Proponents of hard money - such as gold or Bitcoin - are constantly trying to draw attention to the problems of unbacked paper money. To this end, it is a good idea to highlight the various developments that have taken place since 1971 - the end of the last gold standard.
On August 15, 1971, the then US President Richard Nixon "temporarily" suspended the convertibility of the US dollar into gold - the suspension of convertibility continues to this day. The saying "nothing is as permanent as temporary government intervention" is no coincidence.
Before the Nixon shock, foreign central banks were still able to exchange their US dollars for gold at a fixed exchange rate (35 US dollars per troy ounce). As the countries participating in the so-called Bretton Woods system pegged their currencies to the US dollar at a fixed exchange rate, the gold standard effectively ended in 1971 for other countries such as Germany.
The reason for the abolition of the gold standard was the USA's excessive government spending to finance, among other things, the costlyVietnam War (1955-1975)among other things. As a result, foreign countries began to doubt the gold backing of the US dollar and increasingly wanted to exchange their US dollar reserves for gold. This was not without reason, as the ratio of gold to US central bank money had already continued to decline in the preceding years. Although everything was far from perfect before 1971, the abolition of the convertibility of the US dollar into gold ultimately removed a disciplining force for good - which was to make things worse.
The website wtfhappenedin1971.com, which is well-known in the Bitcoin community, lists some developments since 1971
With this article,Blocktrainer.de would like to provide the necessary context, add relevant graphics and leave out overly far-fetched correlations. For this project, we are limiting ourselves to global data and data from the USA so that we cannot be accused of cherry-picking, as was the case with the original website.
The year 1971 is indicated by an orange arrow in the following charts. The charts have been taken from the linked original sources and merely visually edited and translated into German.
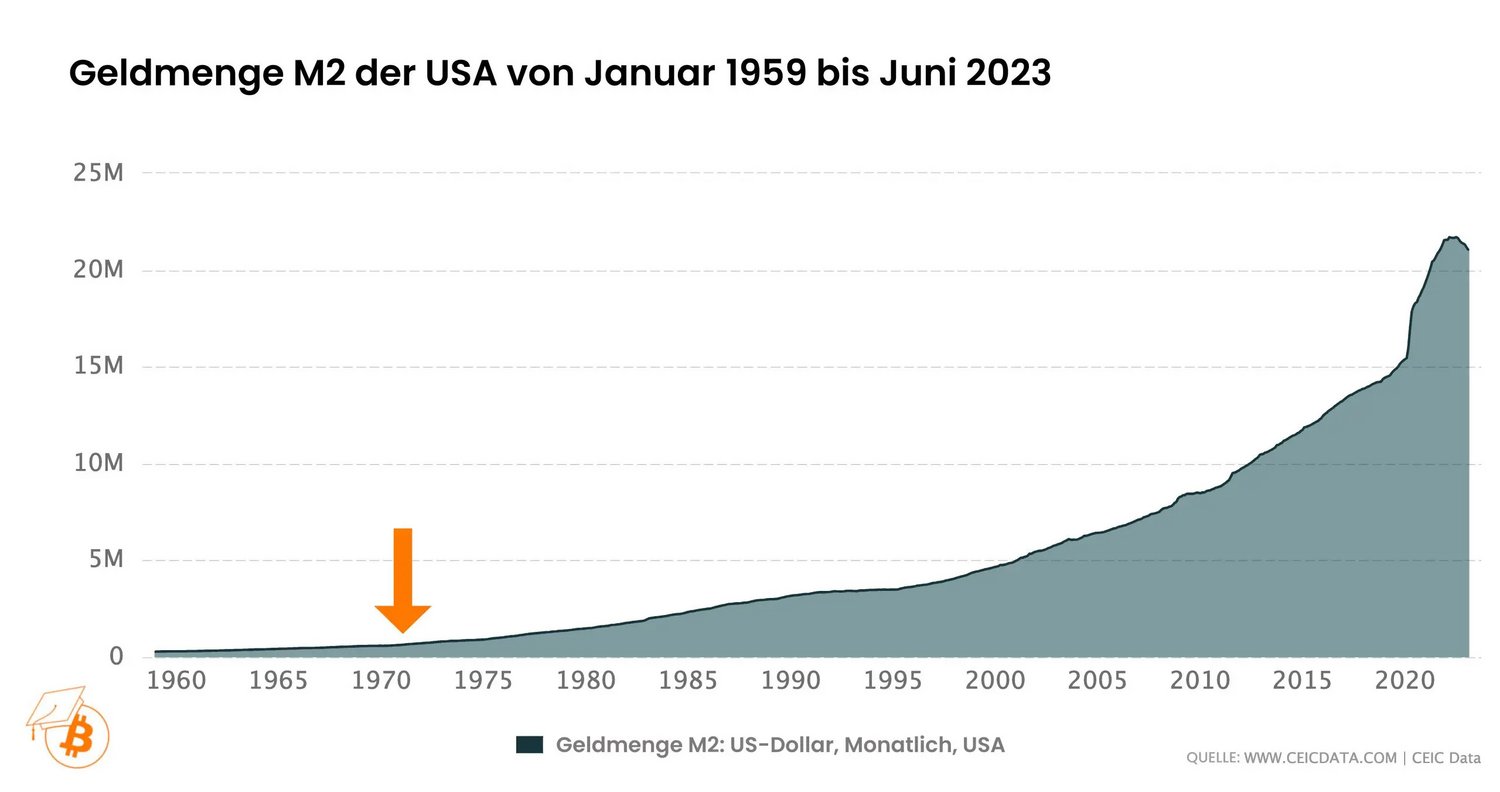
The US dollar money supply in circulation (M2) has increased exponentially since the abolition of the gold standard. Today, there are far more than 30 times as many US dollars in circulation as there were in 1971. The purpose of a hard money standard is to prevent precisely this extent of money supply expansion.
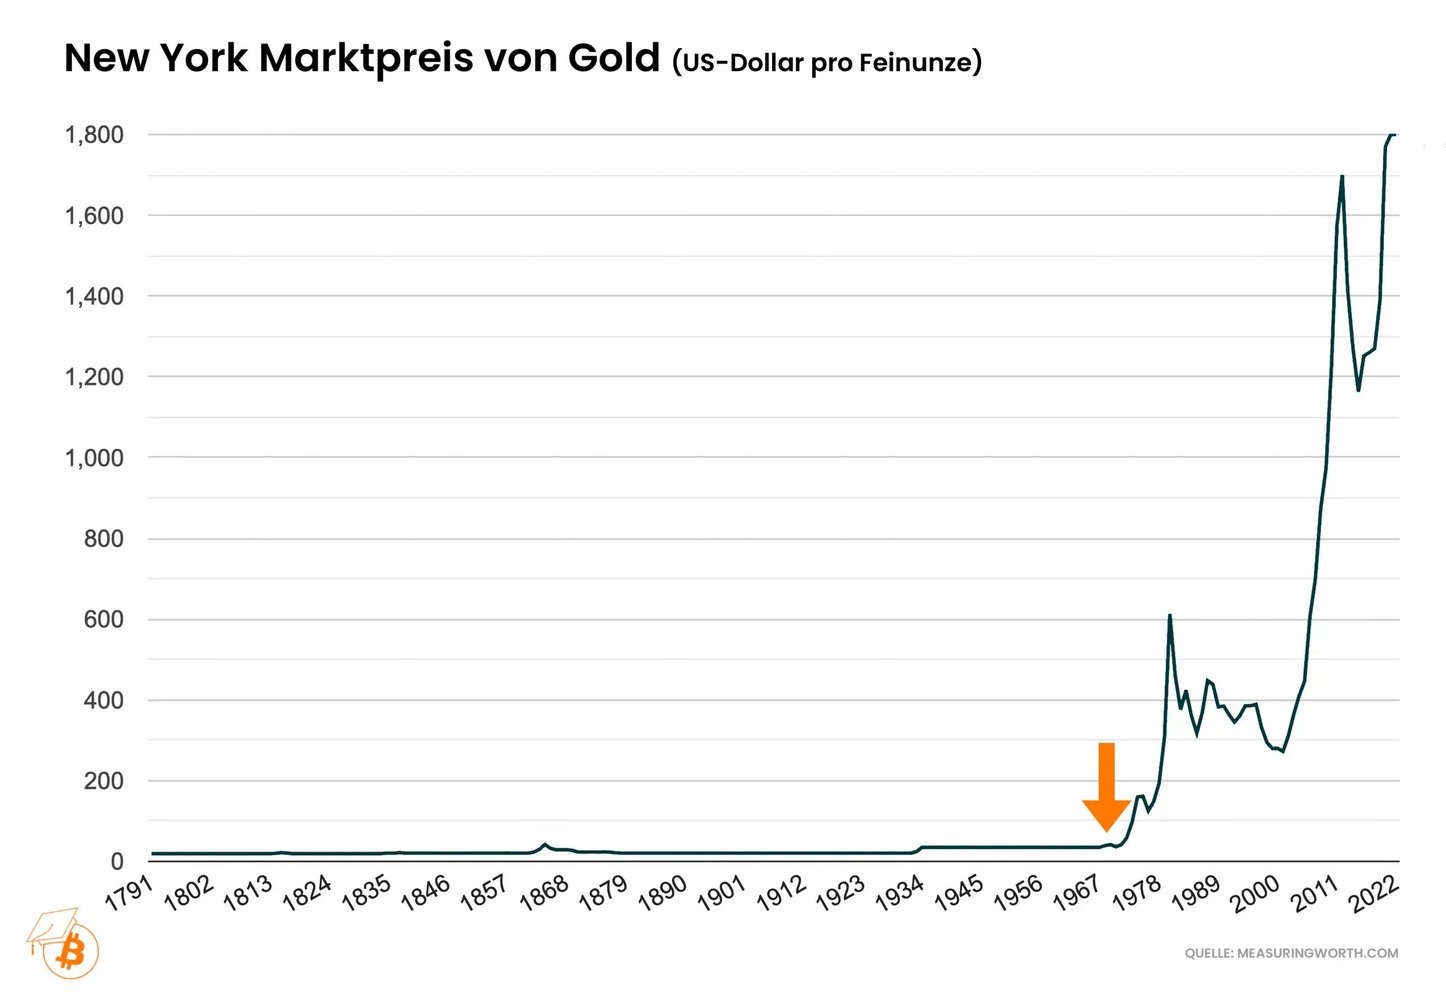
When the US dollar was no longer exchangeable at a fixed exchange rate of 35 US dollars per troy ounce of gold, the price of gold exploded. Today, more than 50 times as many US dollars have to be put on the table to buy a troy ounce of gold as in 1971.
The fact that gold has risen so much in price since then is hardly due to the fact that gold has become much more valuable. Rather, it is because currencies such as the US dollar have lost value due to the expansion of the money supply.
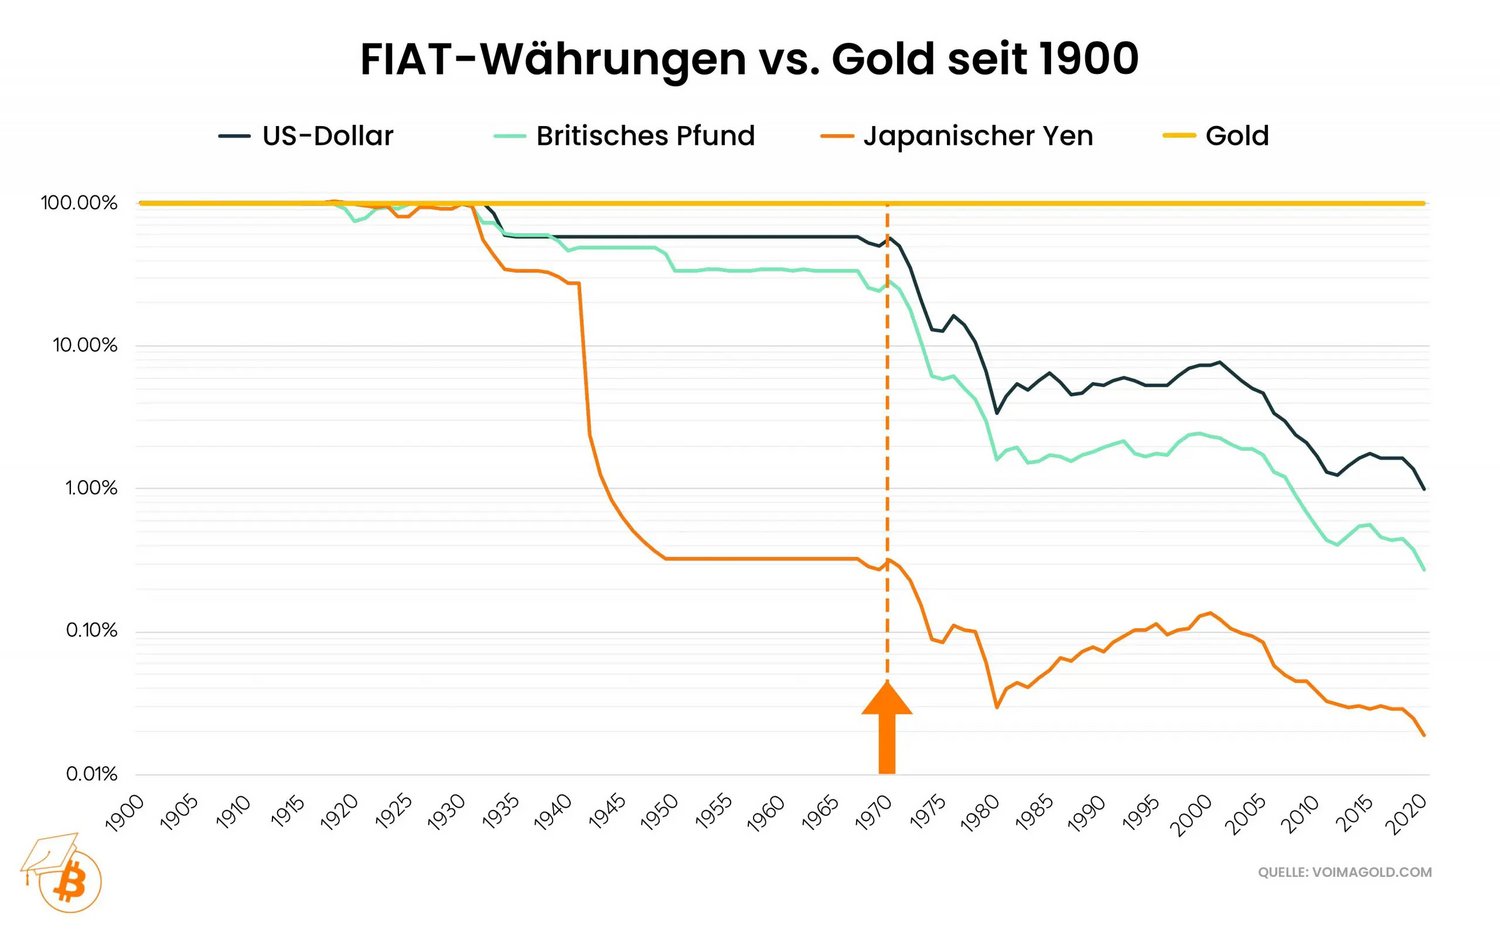
At this point, it makes sense to change the presentation and measure currencies in gold. This makes it easy to see that the British pound, the Japanese yen and the US dollar have depreciated significantly against gold since 1971. As if the following chart were not dramatic enough, it should also be added that it is a logarithmic representation.
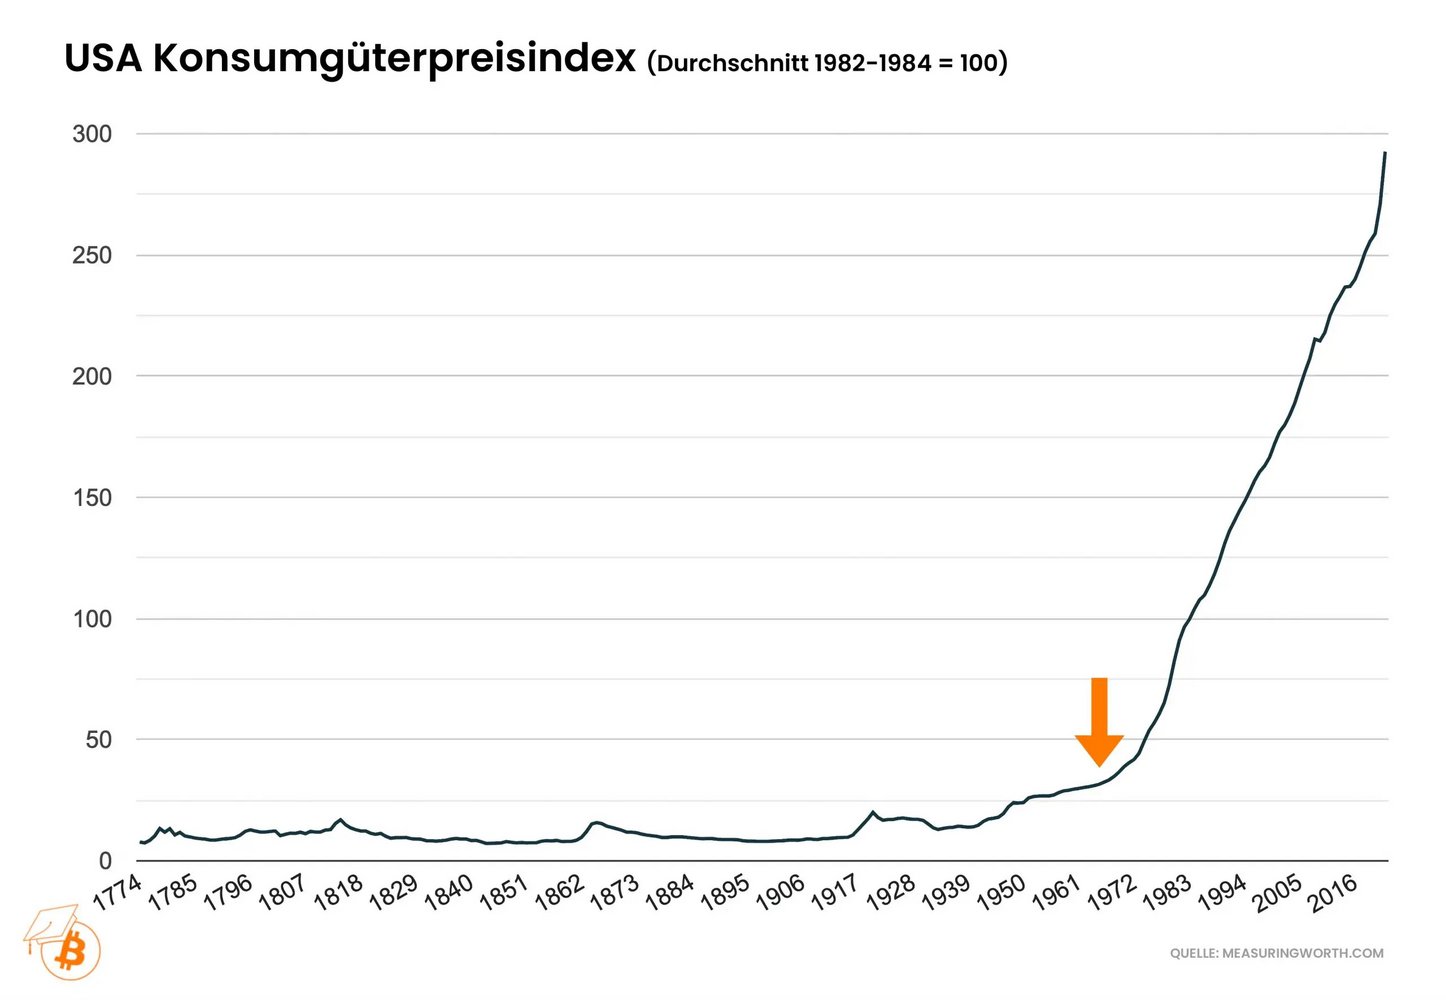
As a result, it is hardly surprising that the US dollar also depreciated against consumer goods due to the expansion of the money supply. After consumer goods prices had remained at a similar level for centuries, they have literally exploded since the end of the gold standard. Consumer goods cost around 10 times as much today as they did in 1971.
Thanks to technological progress, prices should actually be falling across the board. This fact and the questionable composition of the consumer goods price index can explain the difference to the higher growth in the money supply.
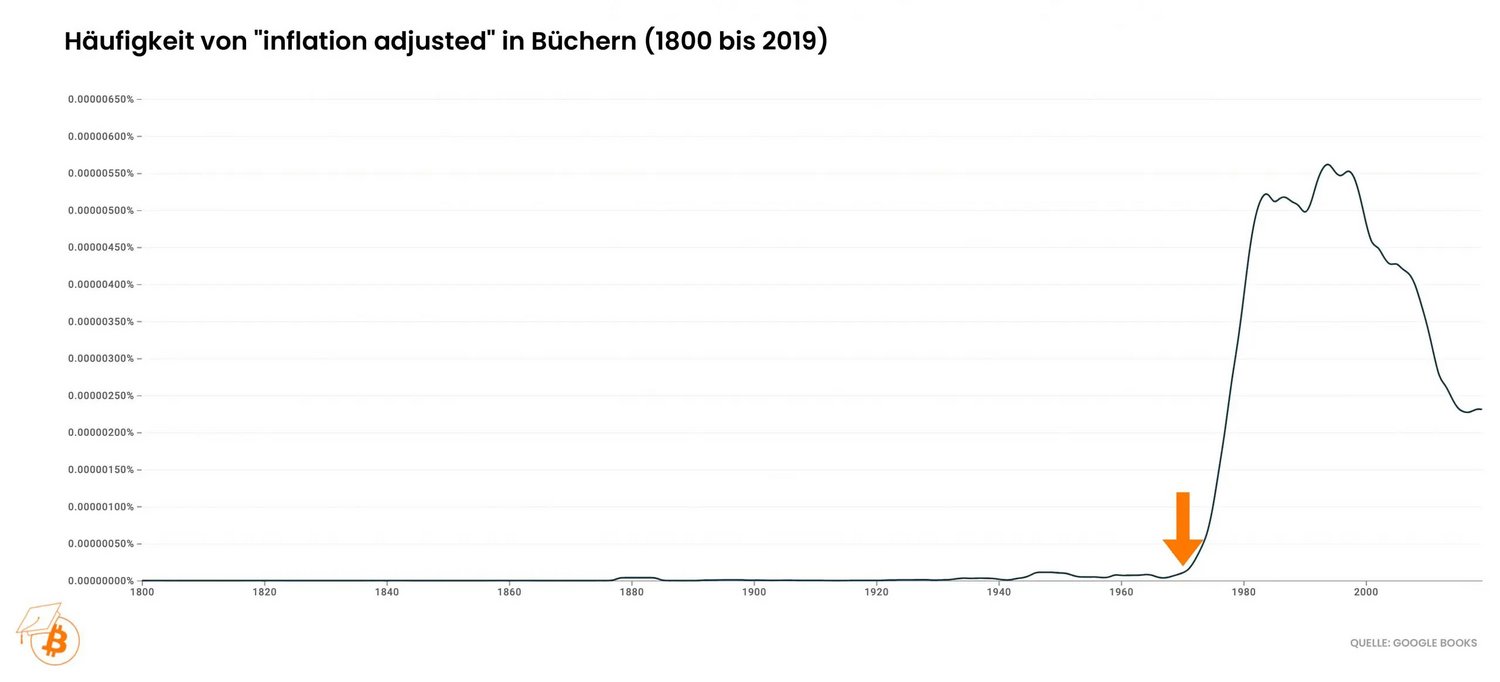
The fact that inflation was not a major issue before the abolition of the gold standard is shown by the frequency of the term "inflation-adjusted" in US books. The frequency has exploded since 1971, which indicates that since then there has been an increasing need to adjust price increases for inflation in order to reflect (supposedly) real developments.
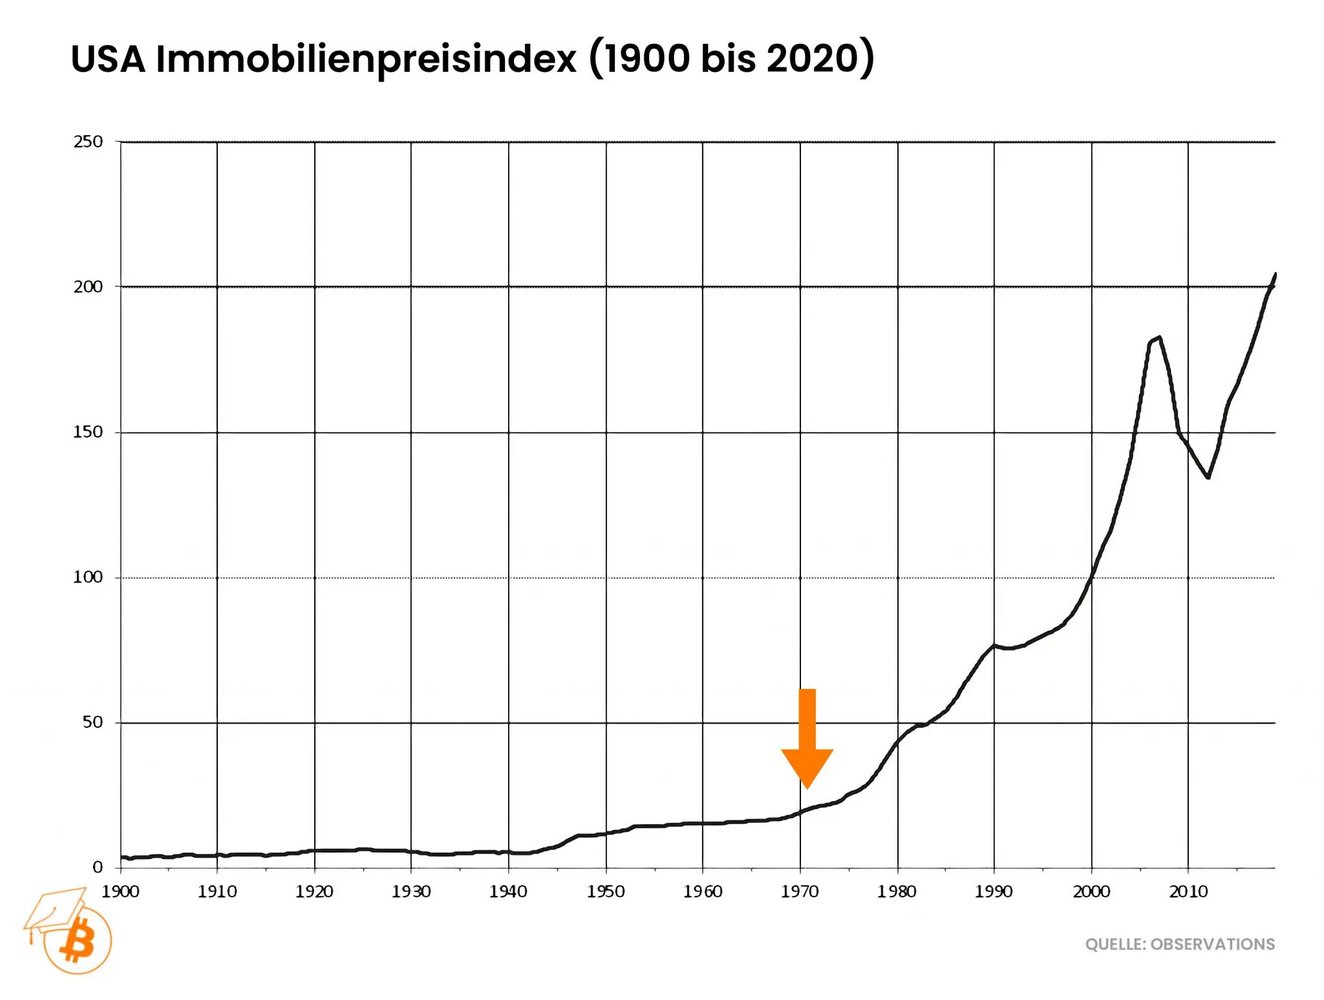
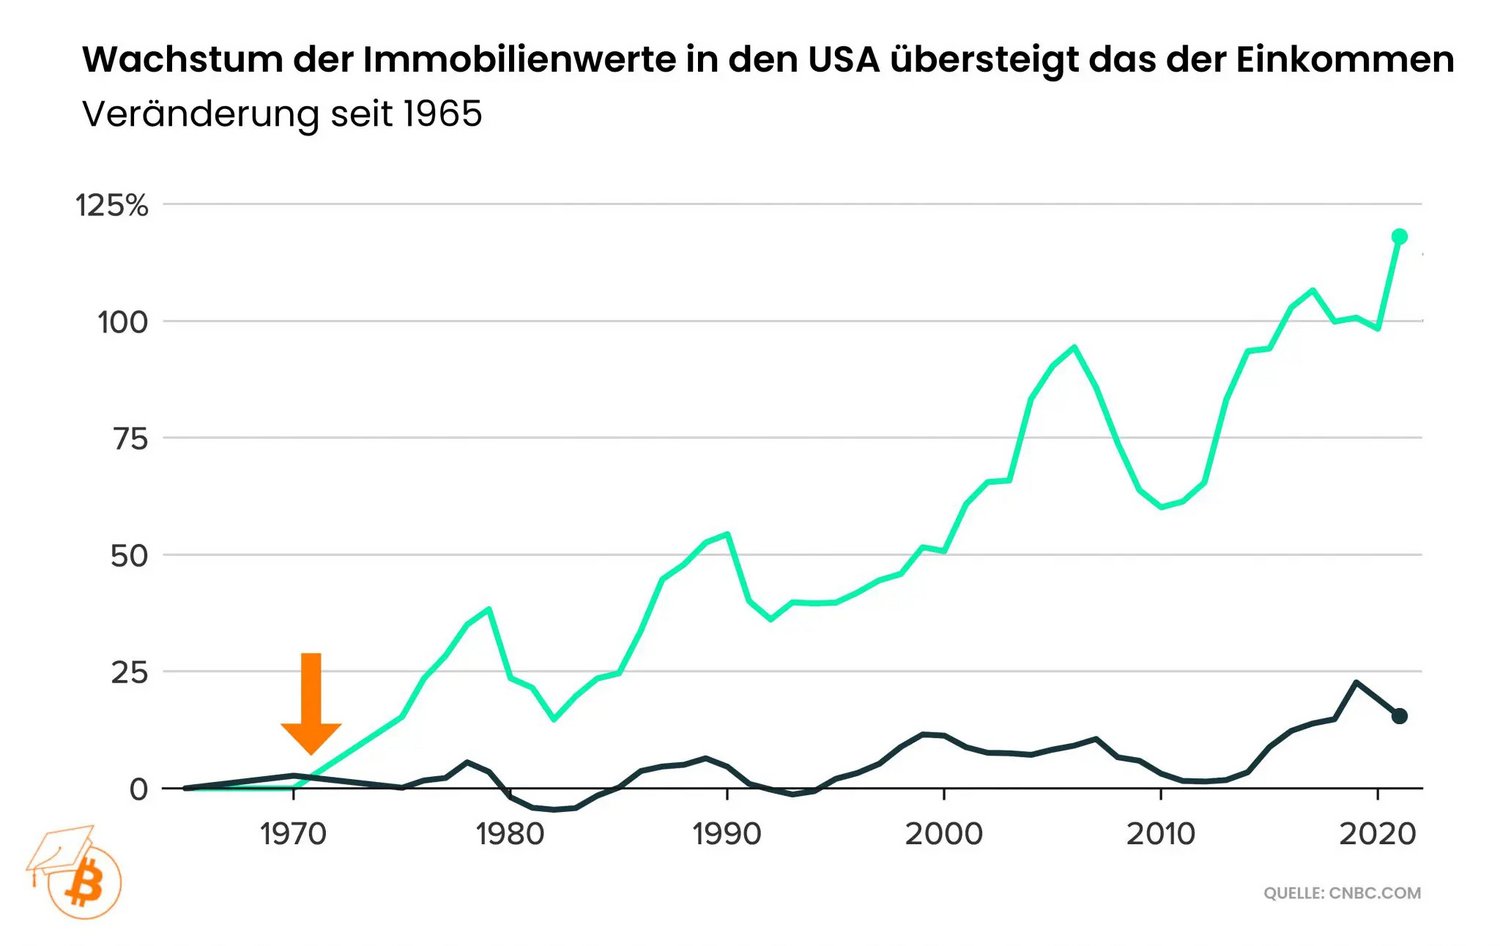
US residential real estate prices also rose rapidly following the abolition of the gold standard. In other words, the US dollar has also lost significant value against real estate since 1971.
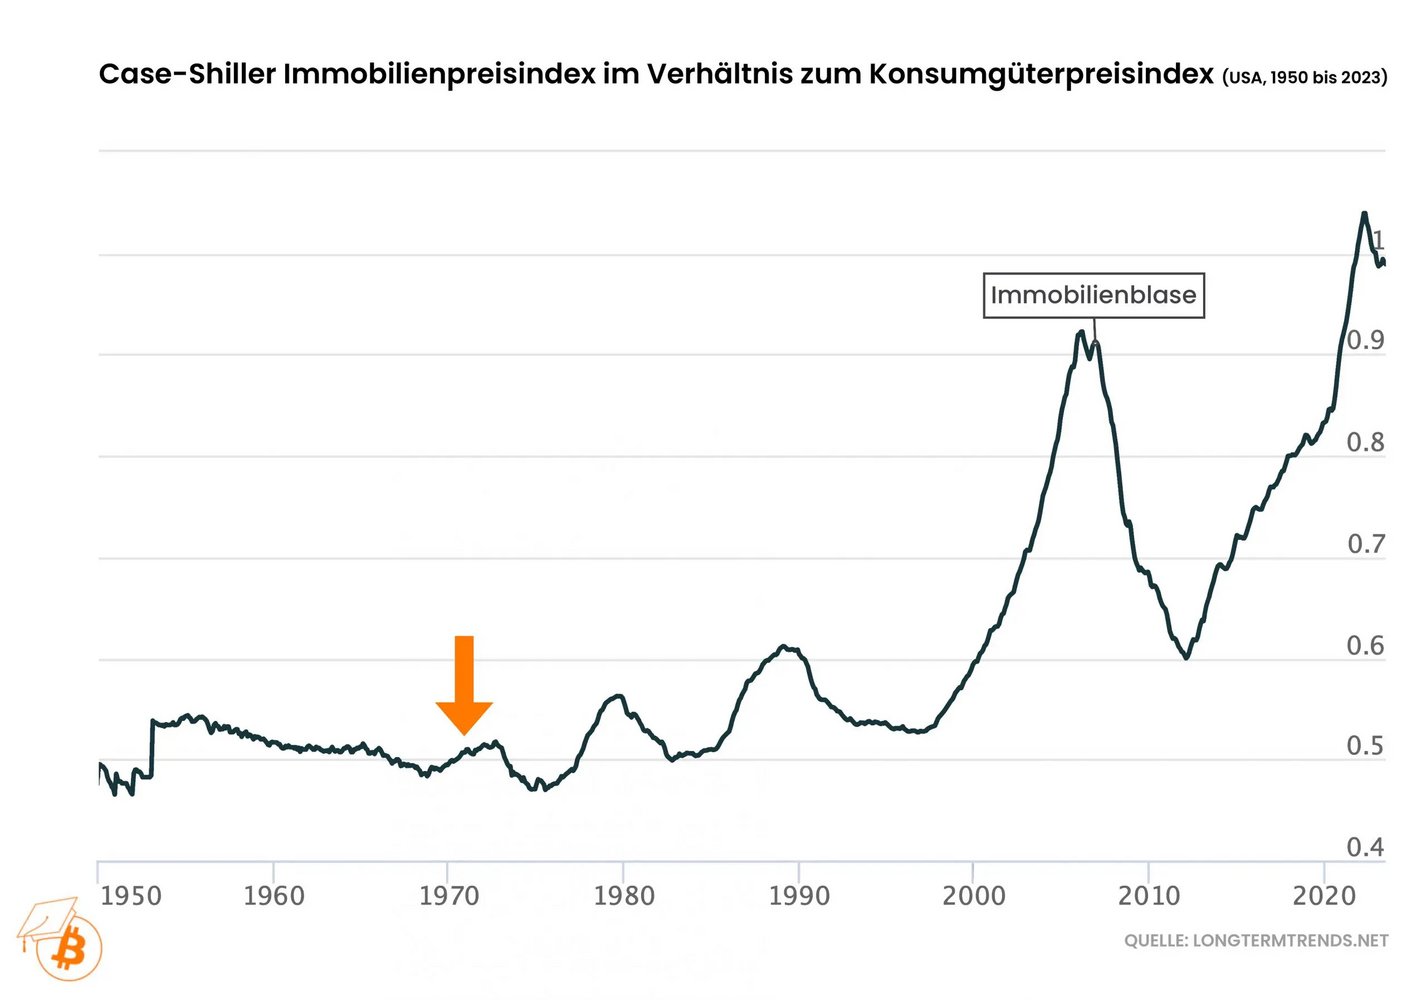
If US real estate prices are adjusted for inflation, then the upward trend that has continued to this day begins after the end of the gold standard - during the gold standard, real real estate prices were roughly constant.
Since then, US real estate prices have risen more strongly than US consumer goods. This fact can be explained by the fact that people have increasingly invested in real estate to escape the loss of purchasing power of money.
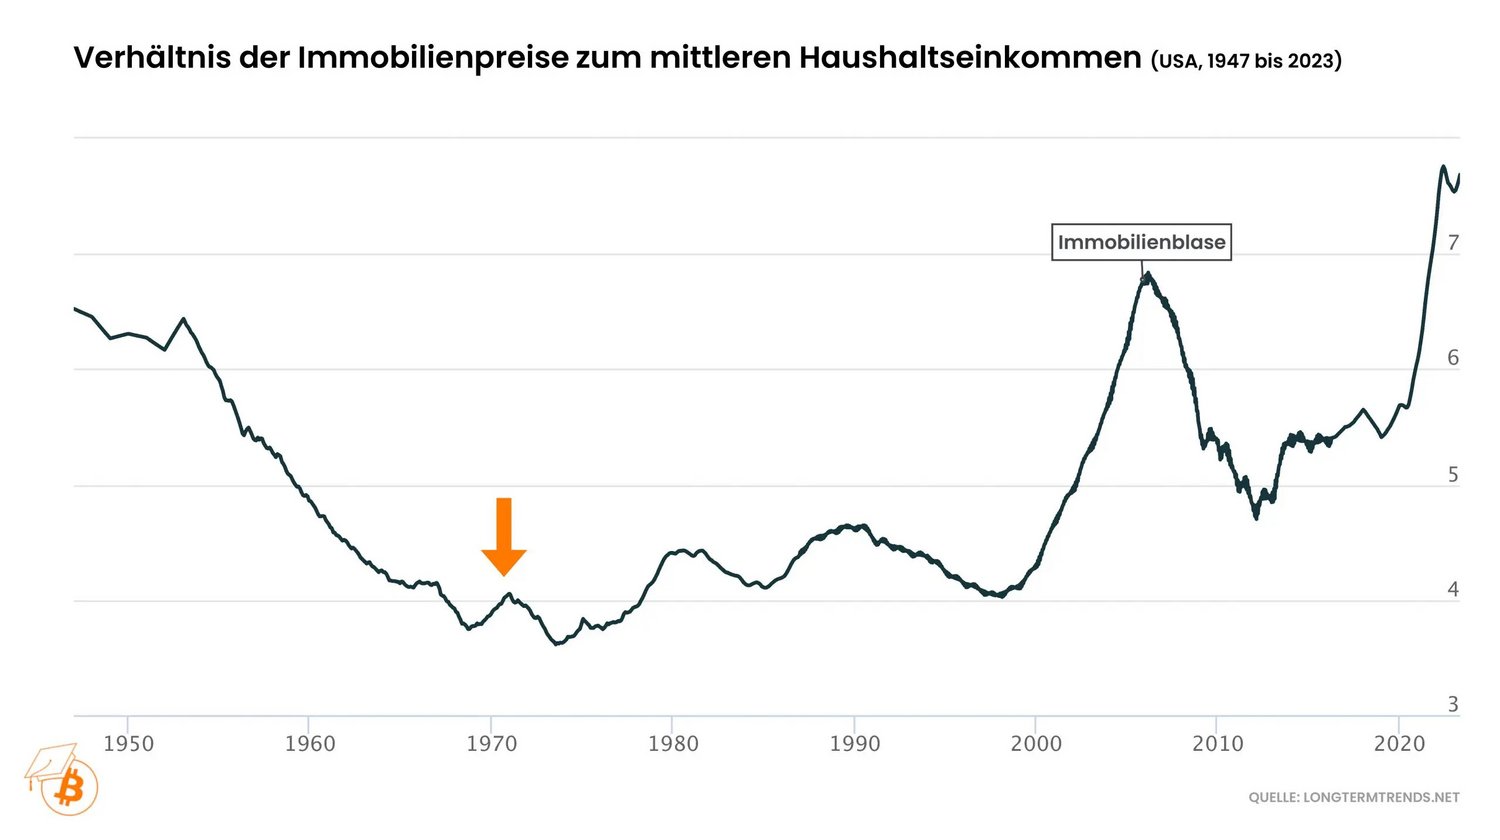
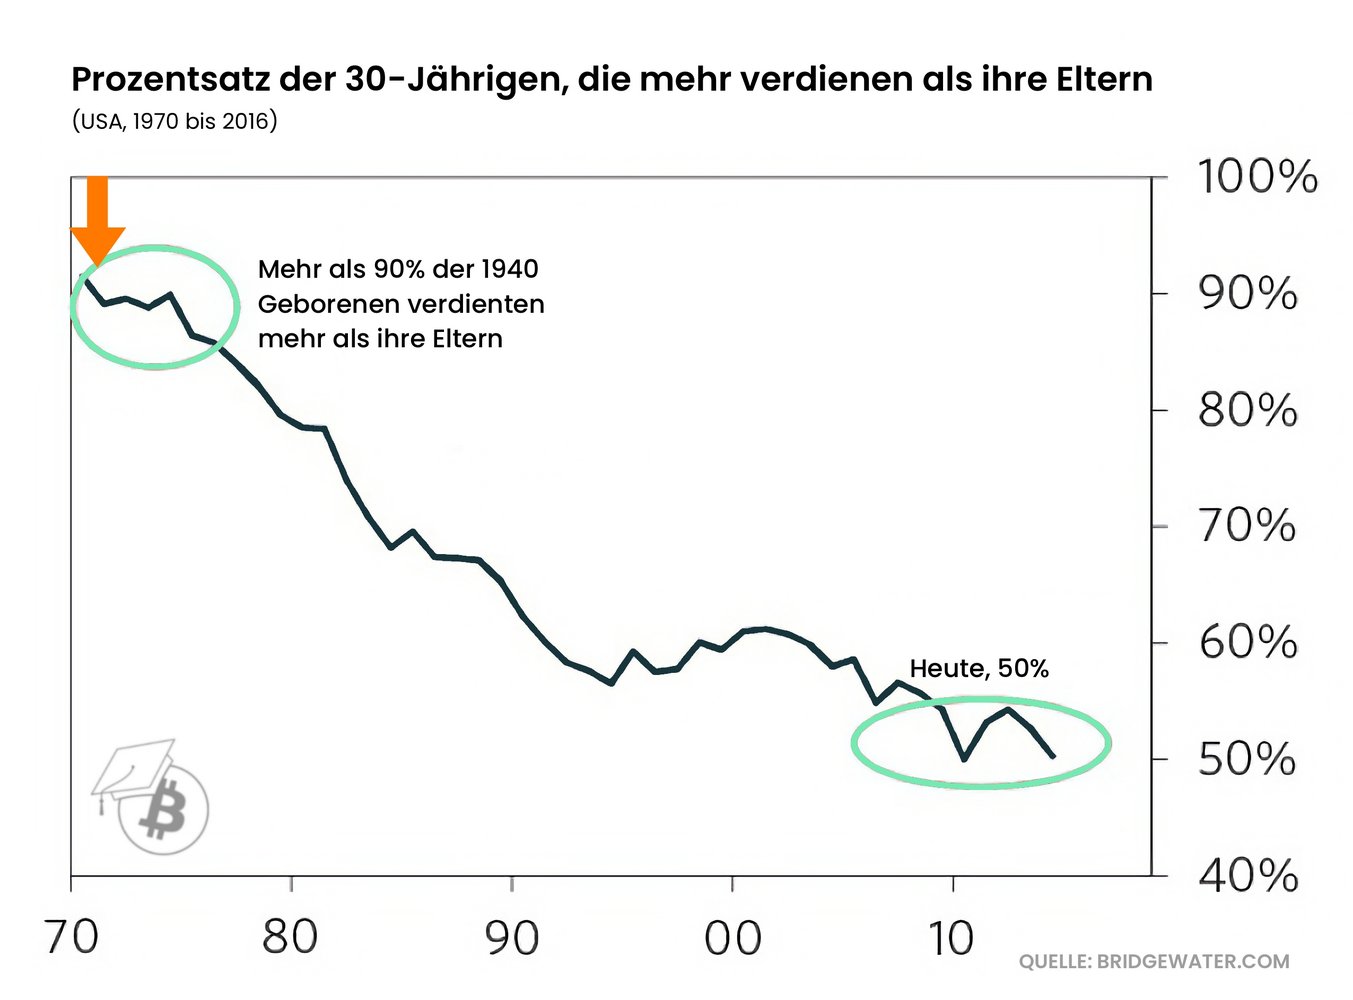
At this point, it is often argued that household incomes have also risen. Before we come to income trends, it makes sense to look at US house prices in relation to the median income of US households.
After decades in which it became increasingly affordable to buy a house with your salary, the period around 1971 marked a change in trend. Since then, the ratio of house prices to income has been rising.
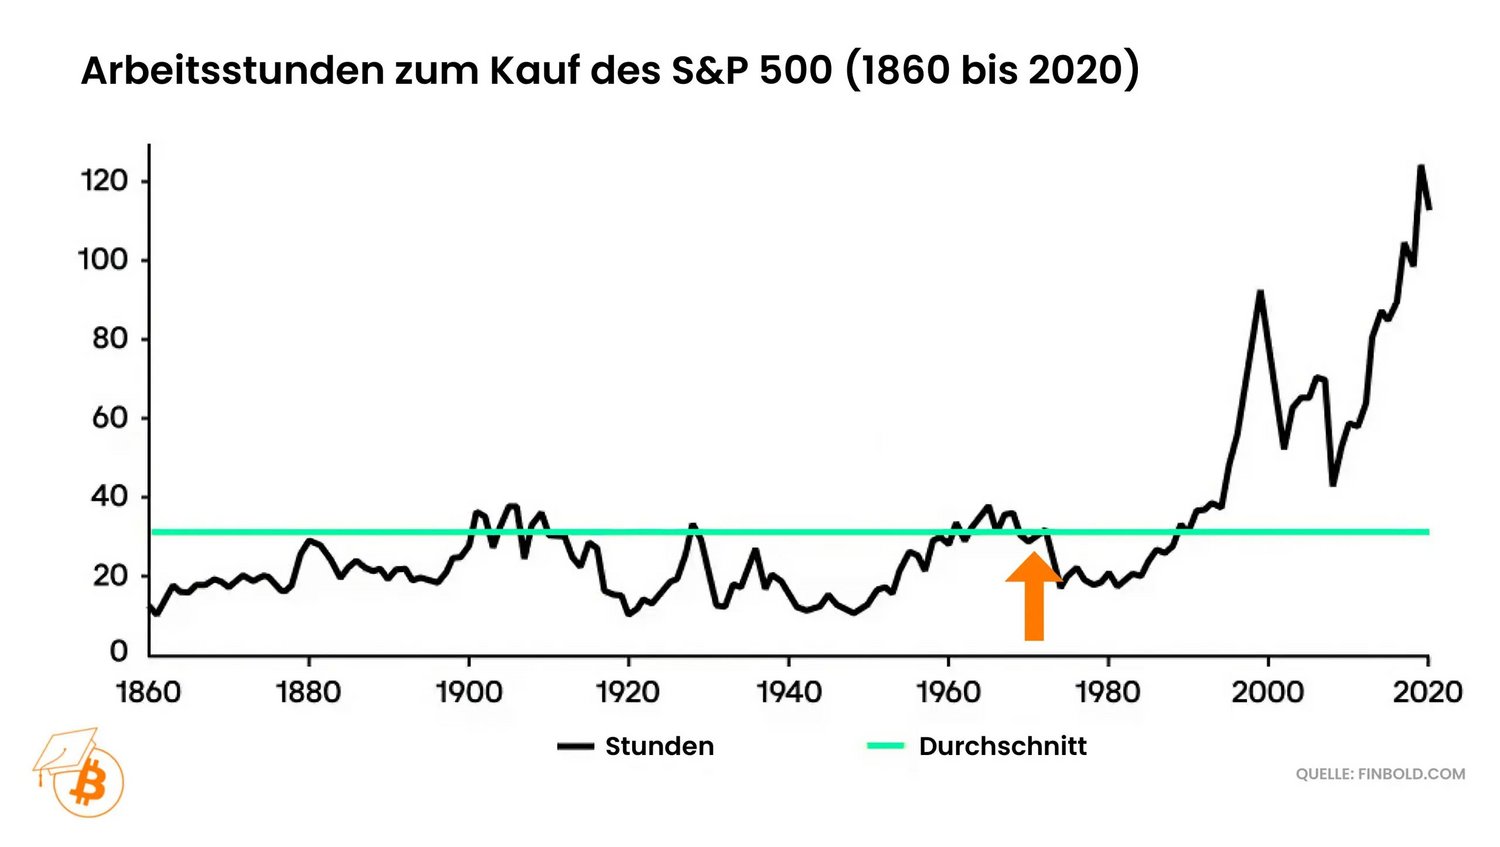
If you put the value of the most relevant share index in the USA in relation to income, then this ratio also exploded immediately after the end of the gold standard, after the ratio had been roughly constant for more than 100 years. Since 1971, it has therefore taken more and more hours of work to buy a share of the S&P 500 share index.
The fact that it has become increasingly expensive in relation to income to participate in the stock market is most likely due to the fact that shares - like real estate - have become a kind of savings object.
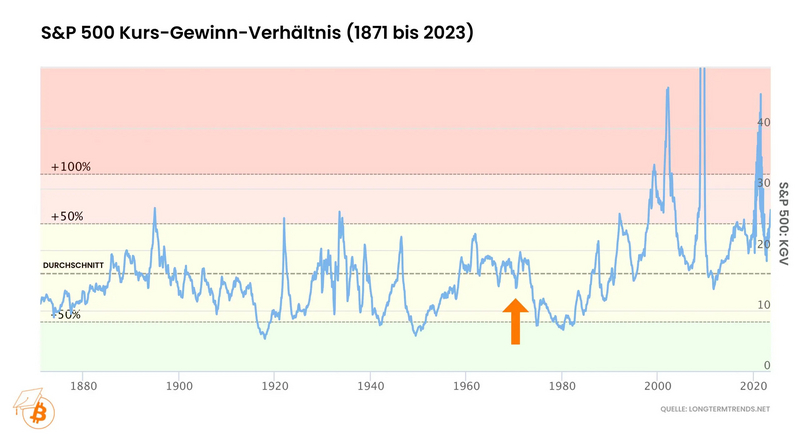
Since the 1970s, the valuation of the US stock market has also risen considerably. If one compares the value of the companies in the S&P 500 with the respective corporate profits, then valuation levels were reached after the end of the gold standard that are far above the historical average. In general, the price/earnings ratio of the S&P 500 has been at a significantly higher level since then.
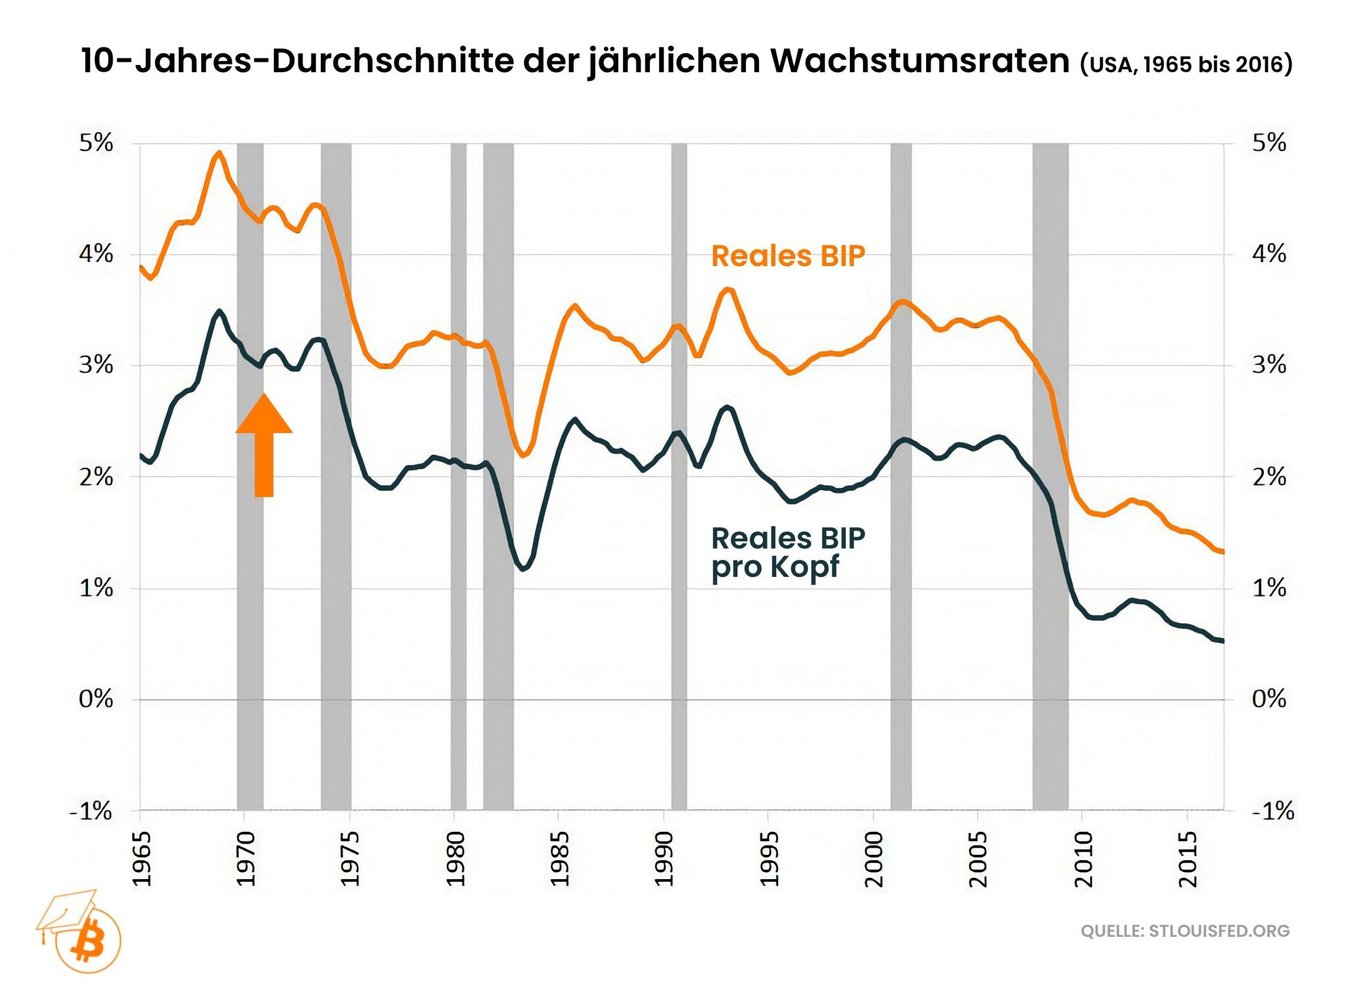
The following chart also makes it clear that a rising stock market in nominal terms is not a sign of a prosperous economy: the long-term growth rate of inflation-adjusted US economic output has clearly been declining since the end of the gold standard - previously it was still rising. The same applies to the inflation-adjusted growth rate of US economic output per capita.
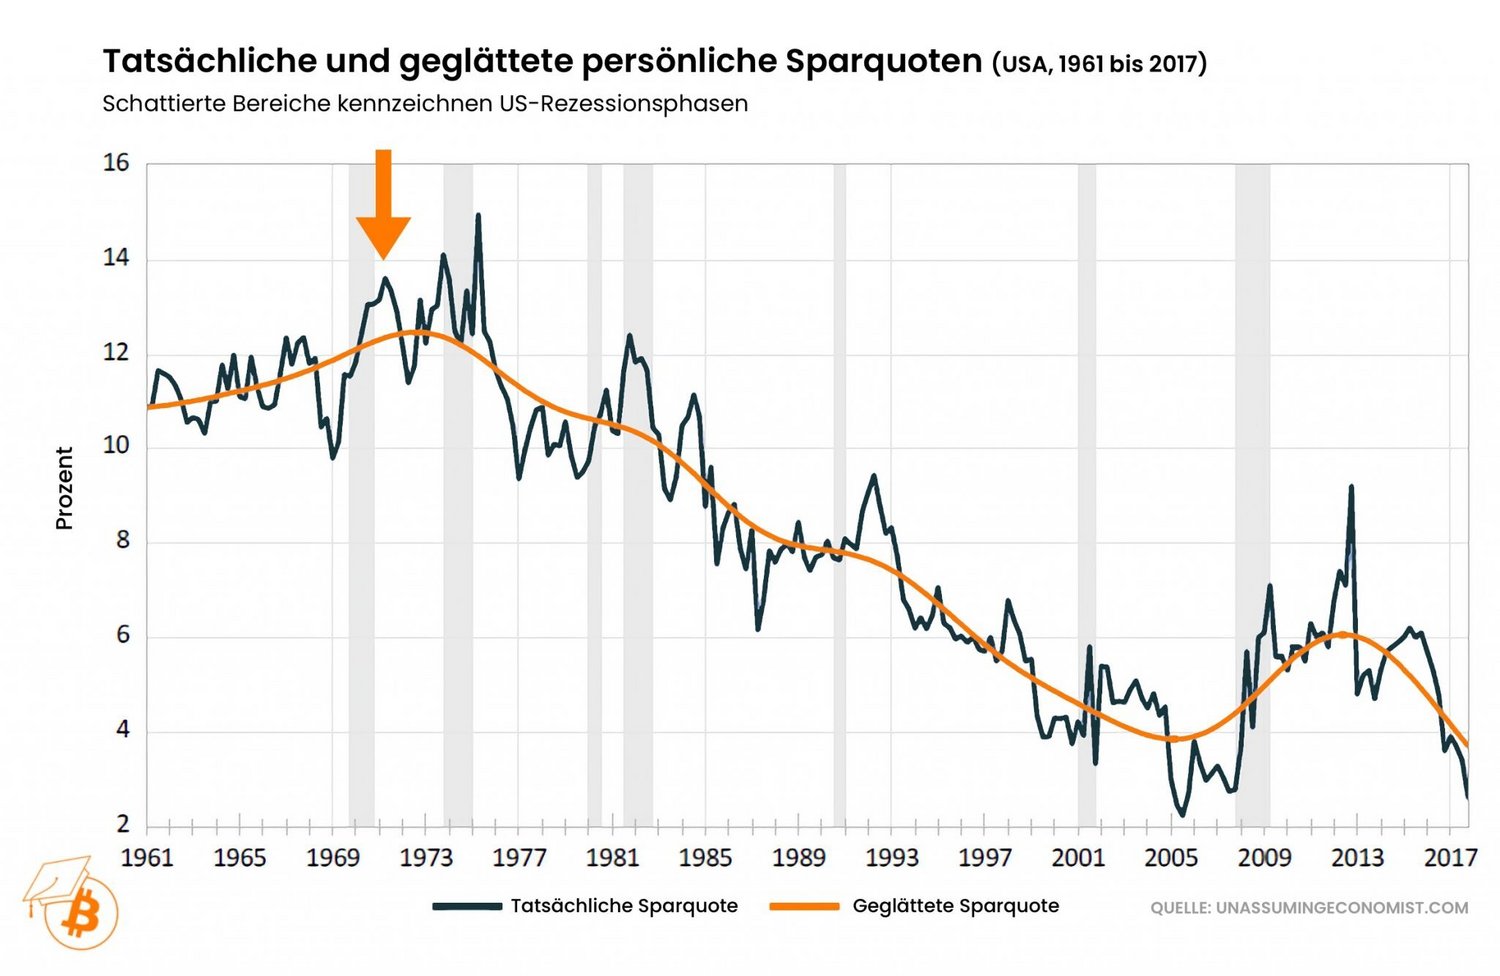
Money that is constantly losing value encourages people to save less. It is therefore hardly surprising that a trend change in the savings rate of US households can be observed immediately after 1971.
Since money has been losing more and more value, Americans have been saving less and less of their income. At the end of the gold standard, Americans were saving just under 14% of their disposable income - a few decades later, they were saving just over two percent.
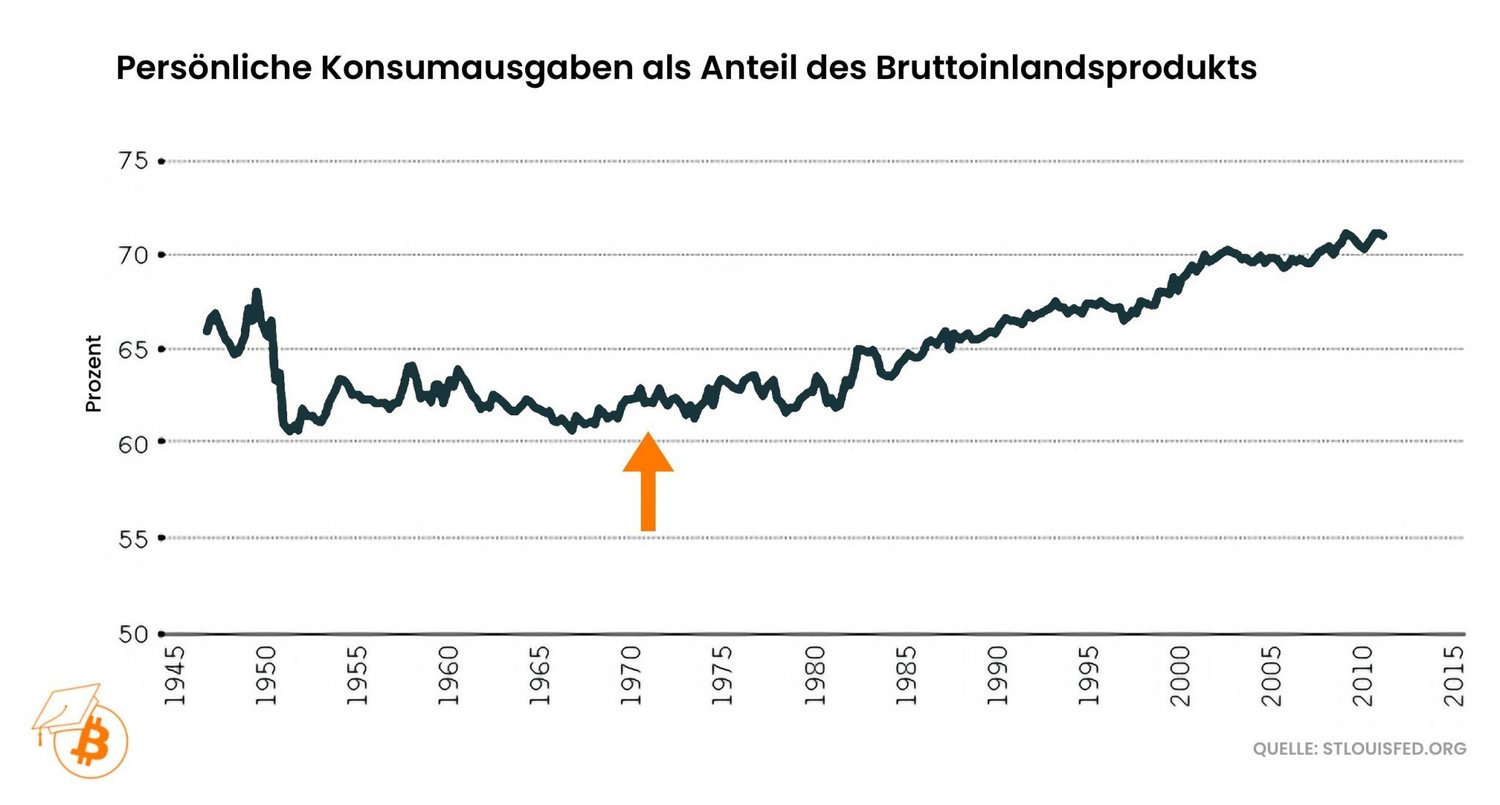
If money loses value, there is an incentive to consume today rather than tomorrow. In this context, there is often talk of a higher time preference, which means that today's consumption is weighted higher than future consumption.
It should therefore come as no surprise that US consumer spending relative to US economic output has risen significantly since 1971. Prior to that, the consumption rate was constant to declining for decades.
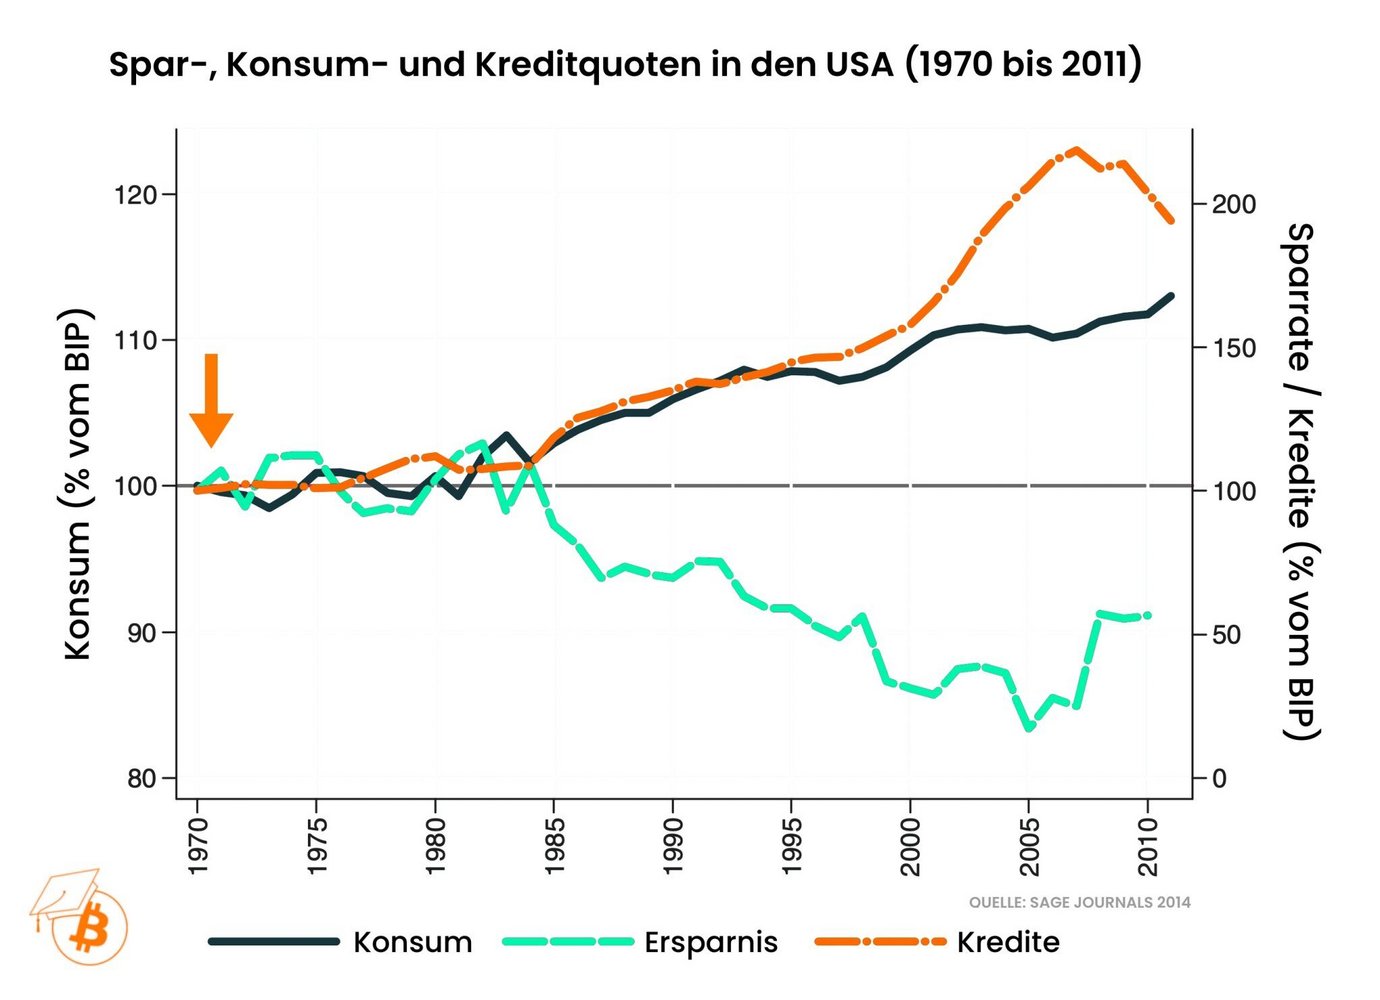
At this point, it is also worth comparing the development of credit, consumption and savings in the USA in relation to economic output.
After the end of the gold standard, the USA saved less and less in relative terms, but consumed more and borrowed more.
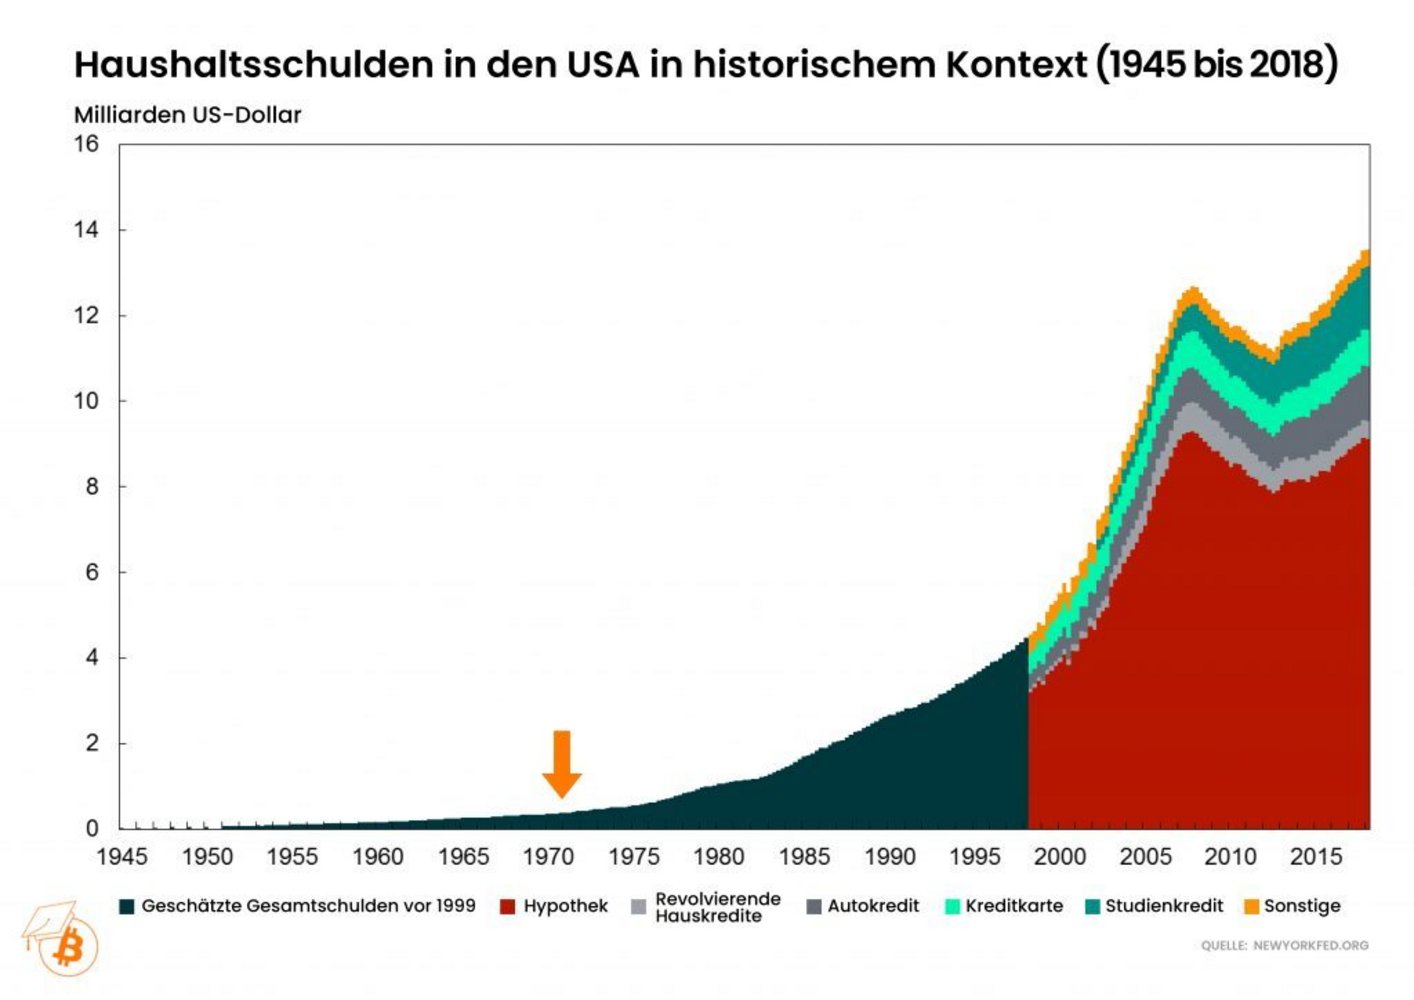
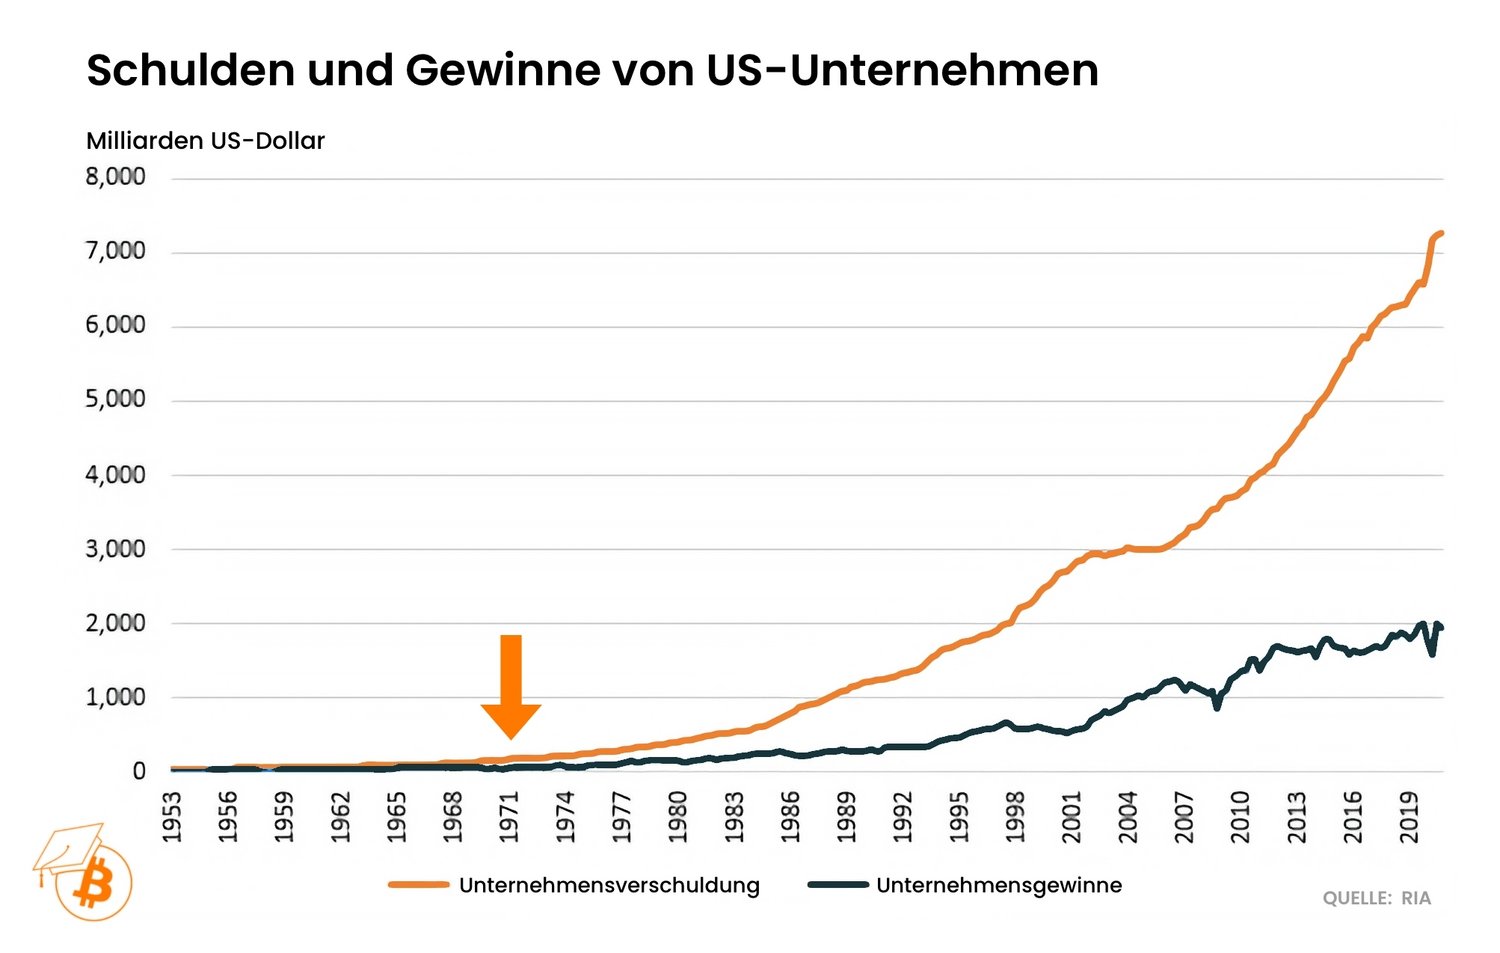
Money that is constantly losing value not only encourages people to save less and consume more, but also to take on debt - the debt then also loses value over time. It is therefore not surprising that US household debt has risen exponentially since 1971.
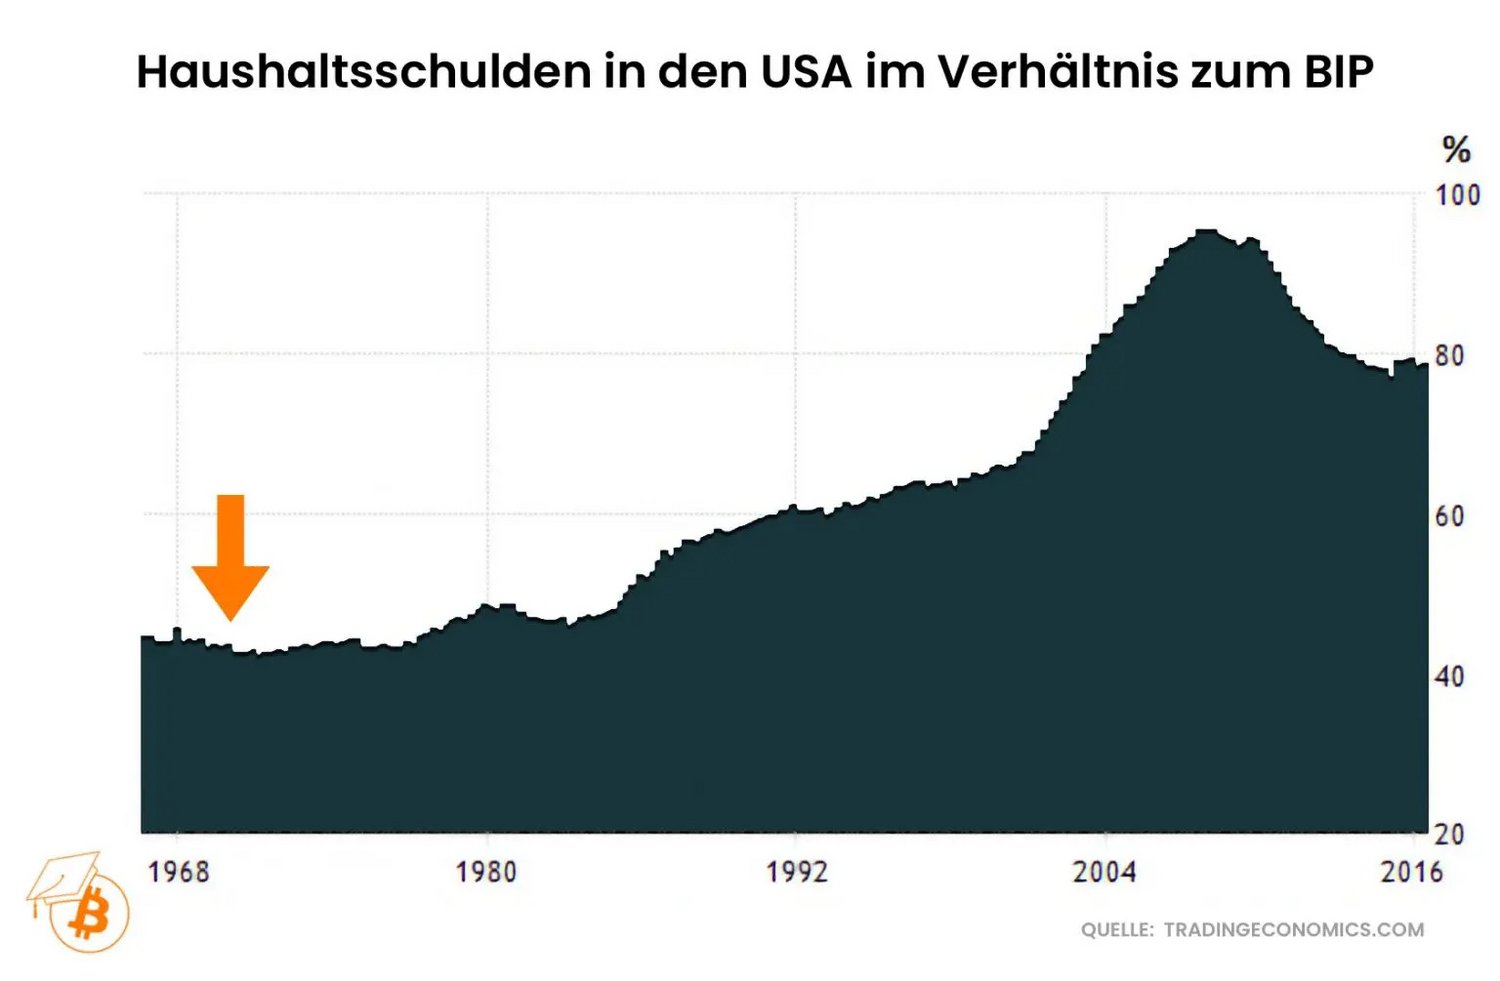
To dispel any doubts about the dramatic nature of the debt explosion, it is worth putting US household debt in relation to US economic output. Here, too, we see an enormous increase since 1971, which means that the population's debt has risen significantly more than economic output.
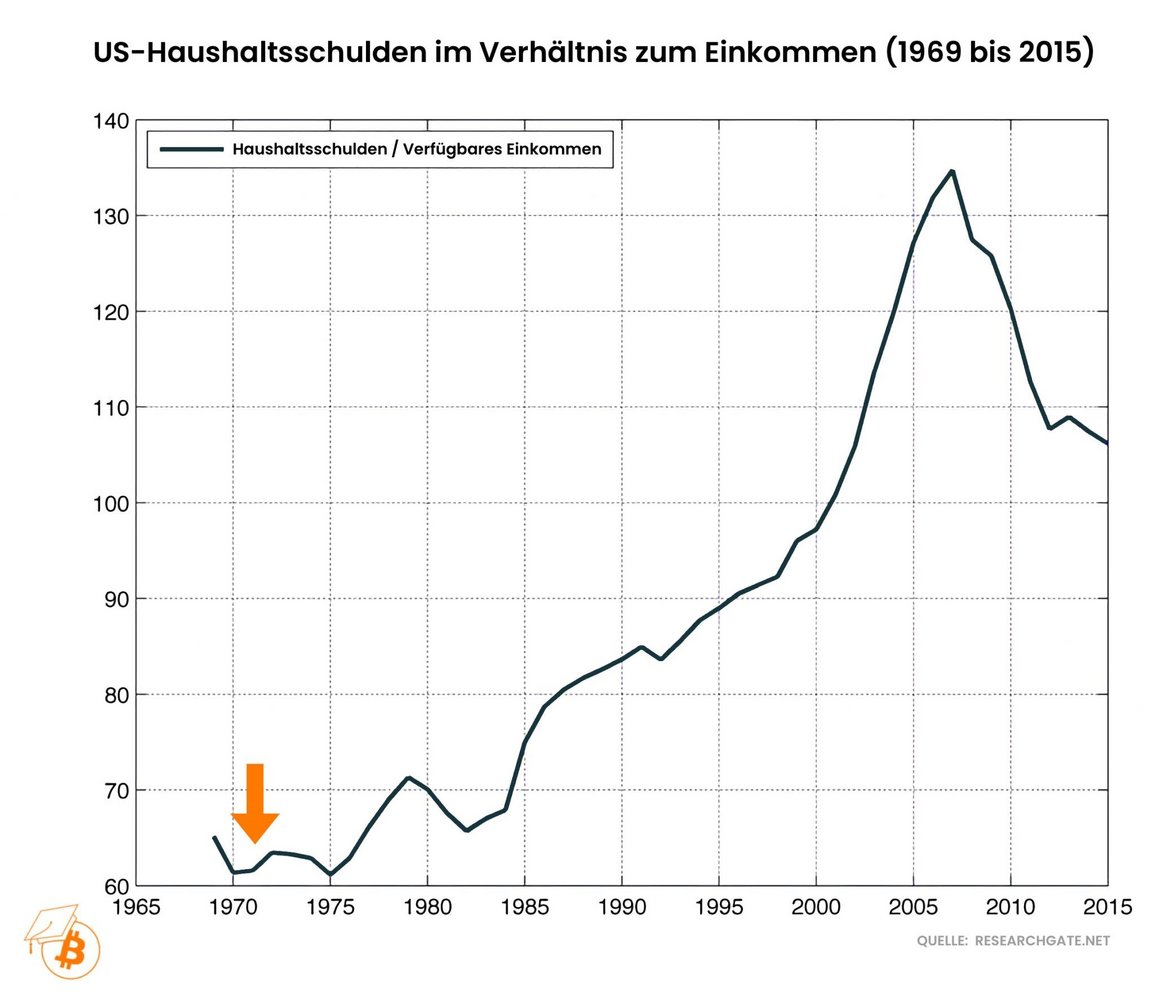
US household debt looks even more dramatic when put in relation to disposable household income. Ultimately, it makes perfect sense to put debt in relation to disposable income.
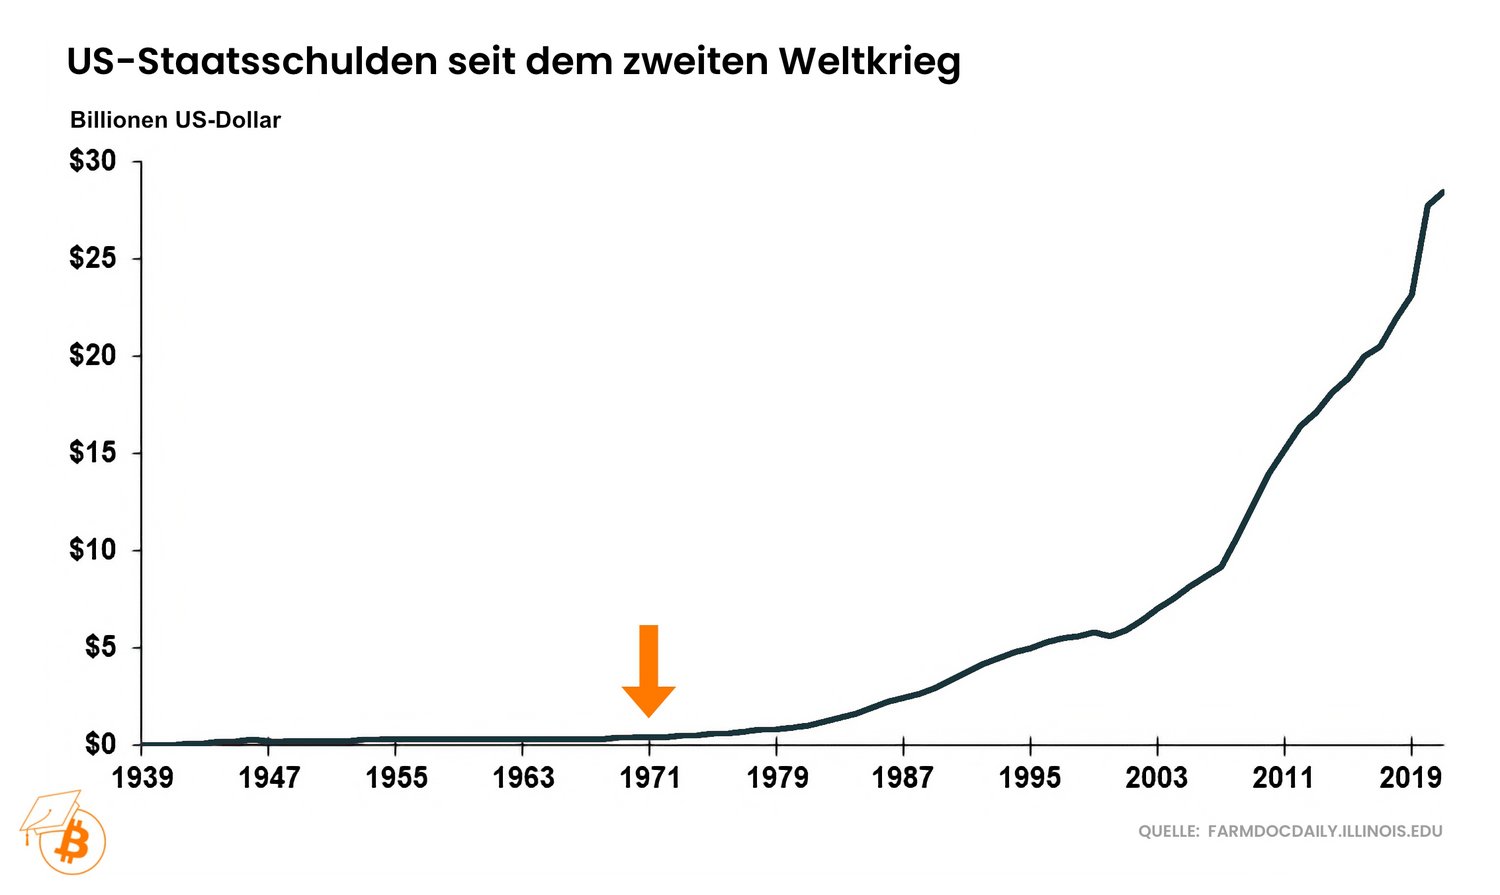
An even clearer picture emerges if we take a look at the development of US government debt. US government debt has literally exploded since 1971. Today, the US has far more than 80 times as much debt as it did when the gold standard was abolished.
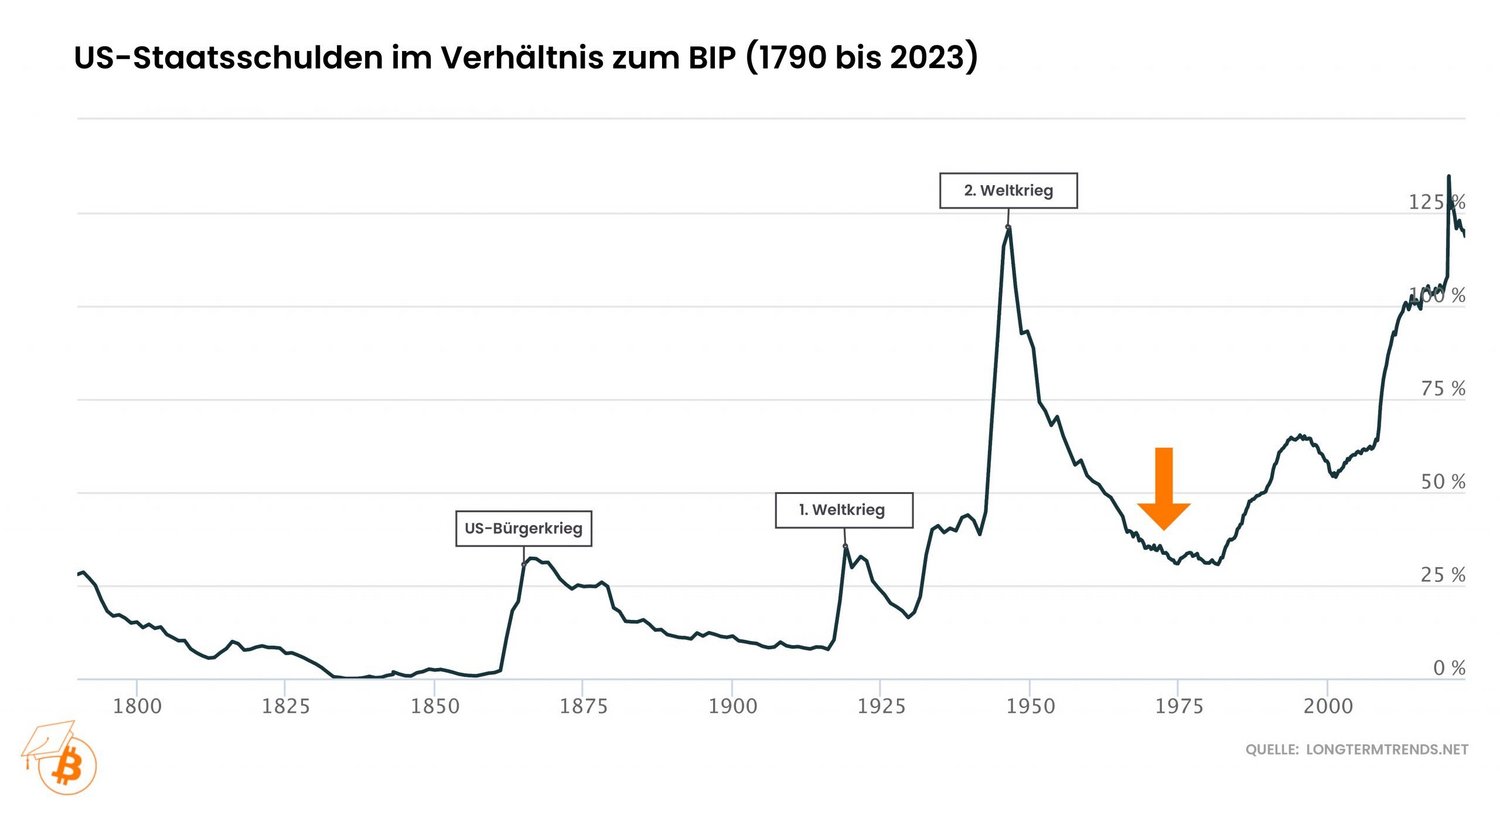
If one compares the US national debt to US economic output, a drastic increase has also been observed since then - a country's economic output is the primary indicator of how much a state earns.
After the relative debt burden was successfully reduced after the end of the Second World War (1939-1945), it has risen dramatically again since the 1970s - even without involvement in comparable wars, which were previously always responsible for such an explosion in US debt.
Reading tip: Article series - How Bitcoin can prevent wars
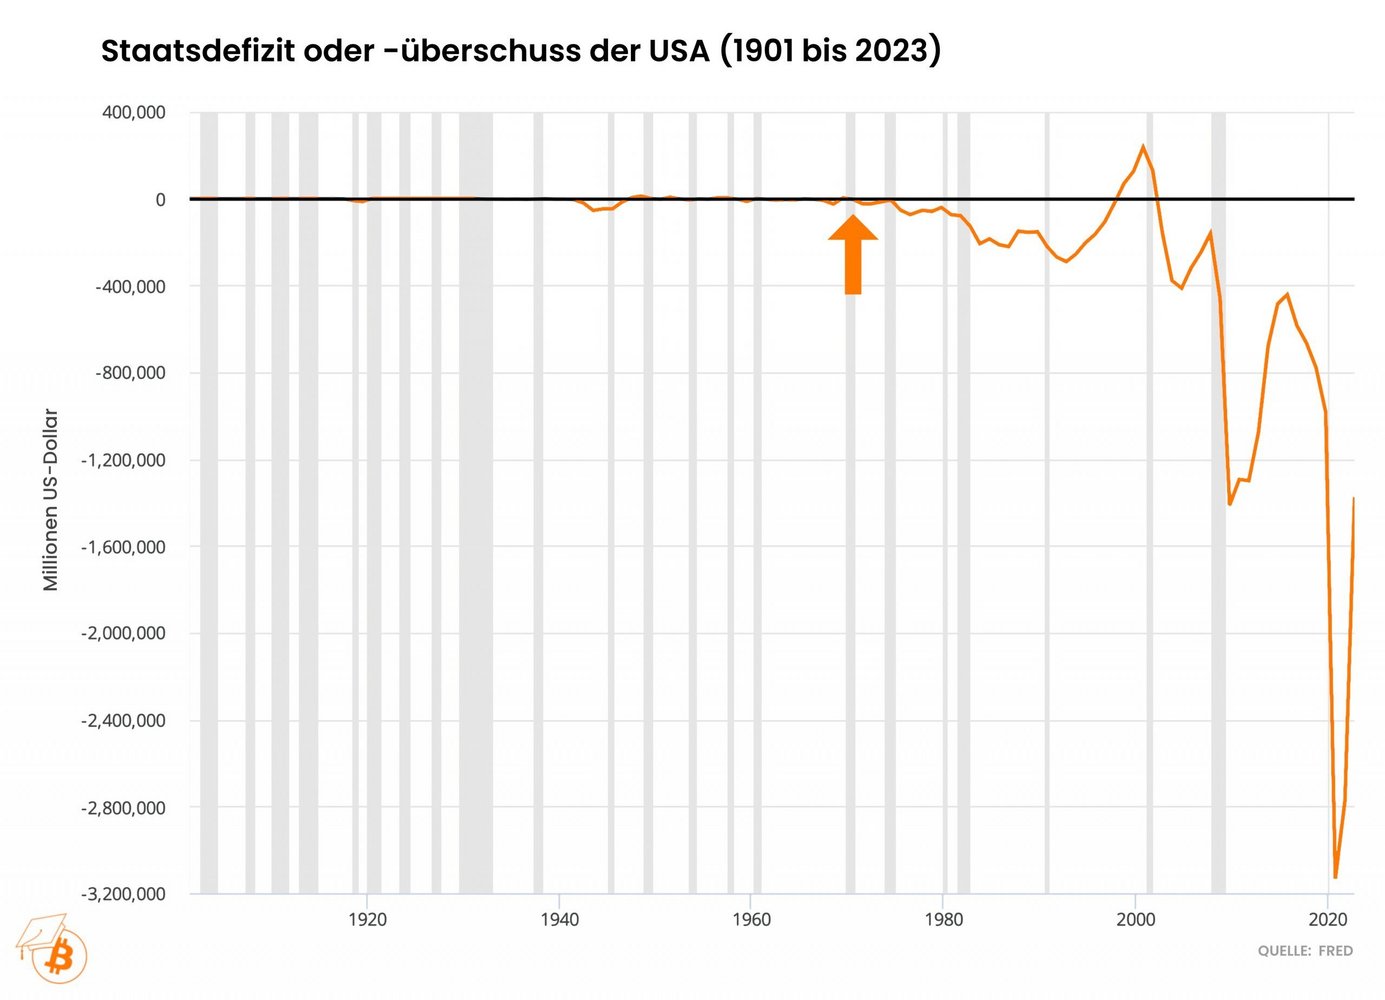
The fact that the US central bank can lend the USA virtually unlimited amounts of money (via detours) after the abolition of the gold standard logically favors this development.
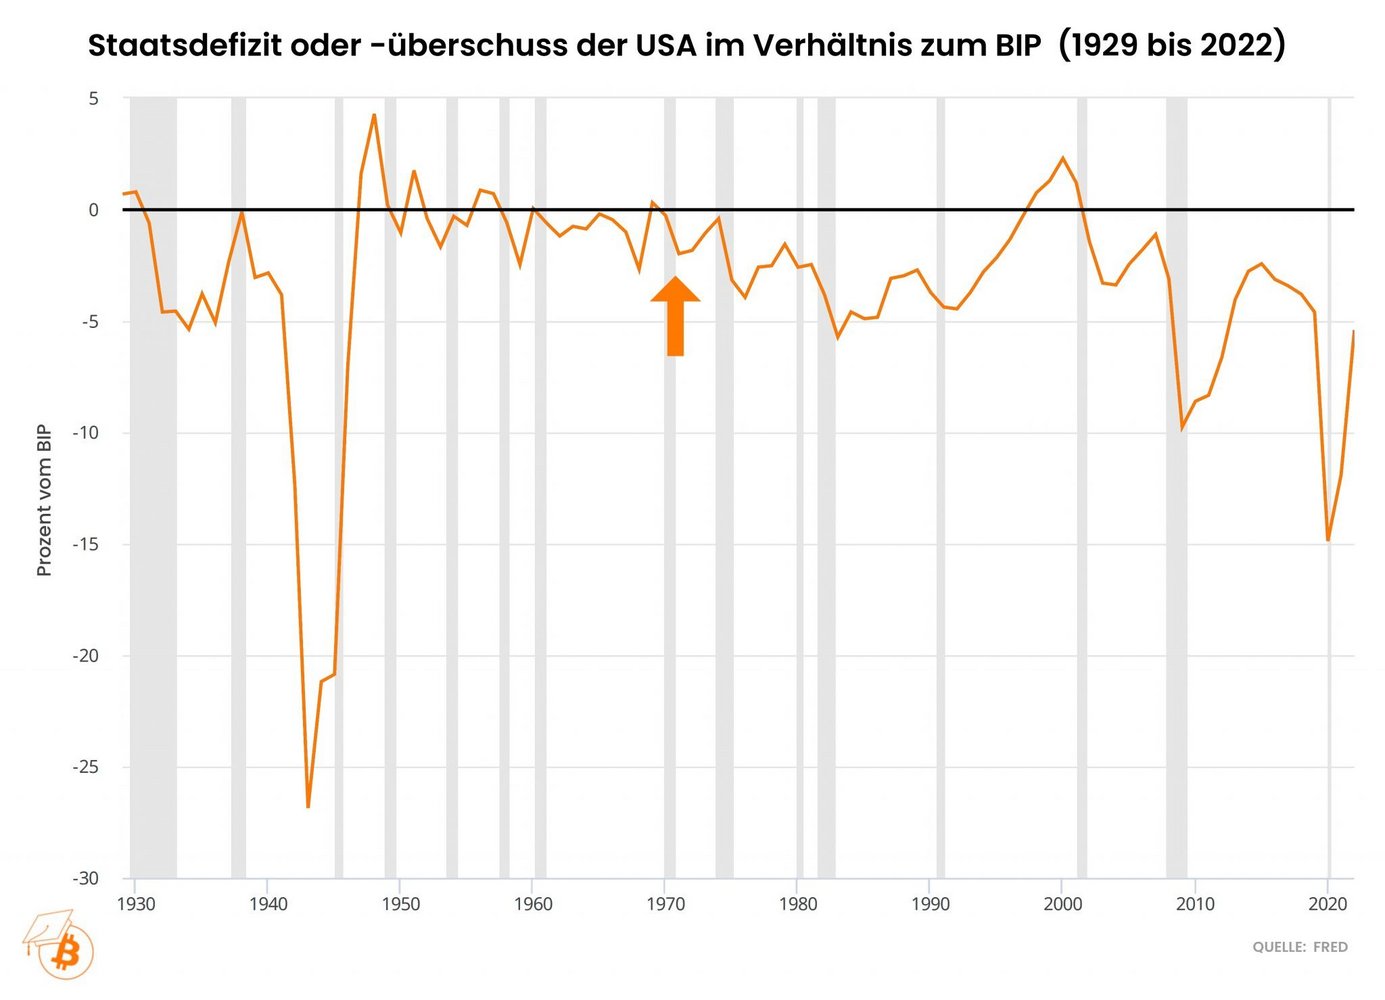
This is also clear from another perspective: since the abolition of the gold standard, the US has increasingly been spending more money than it has been earning - previously, US income and expenditure were roughly balanced.
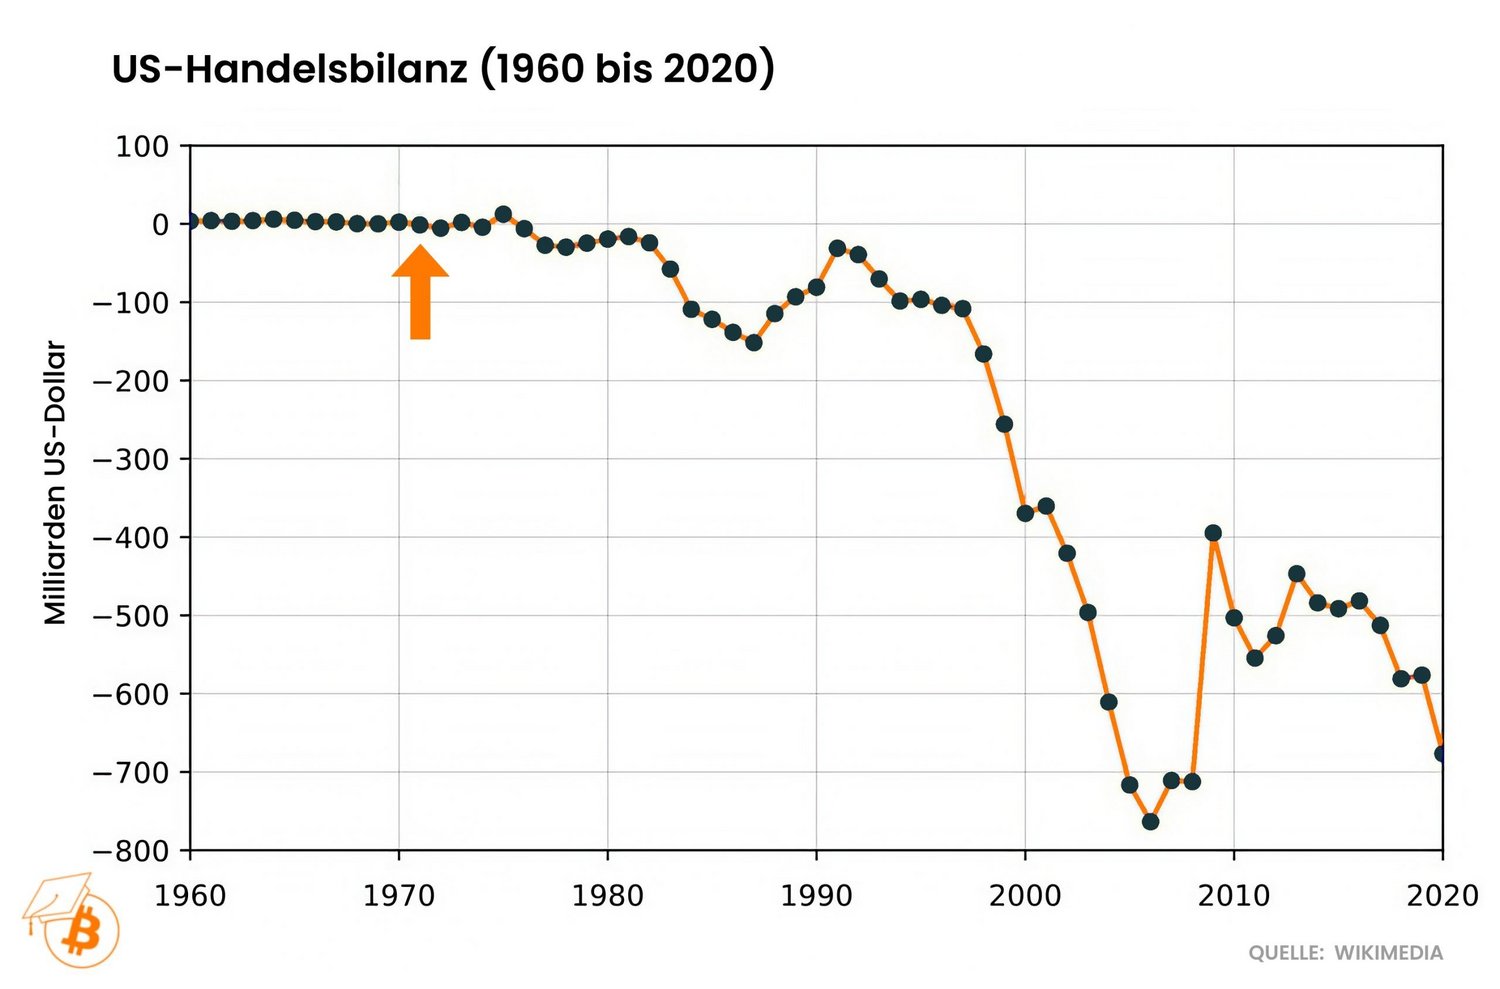
The US also took the opportunity to go on a shopping spree around the world with its US dollars, which it has been able to create out of thin air since the end of the gold standard (in cooperation with the US central bank). The fact that the US dollar is still the world's reserve currency, in which oil was exclusively offered for sale, also came in very handy for this project. In principle, this means that the USA was able to print its own money in order to buy scarce resources from other countries.
This can be clearly seen by looking at the US trade balance: since the end of the gold standard, the USA has been importing an ever greater value of goods than it sells abroad. Ultimately, they are only exporting their US dollars, which they can create at a cost close to zero.
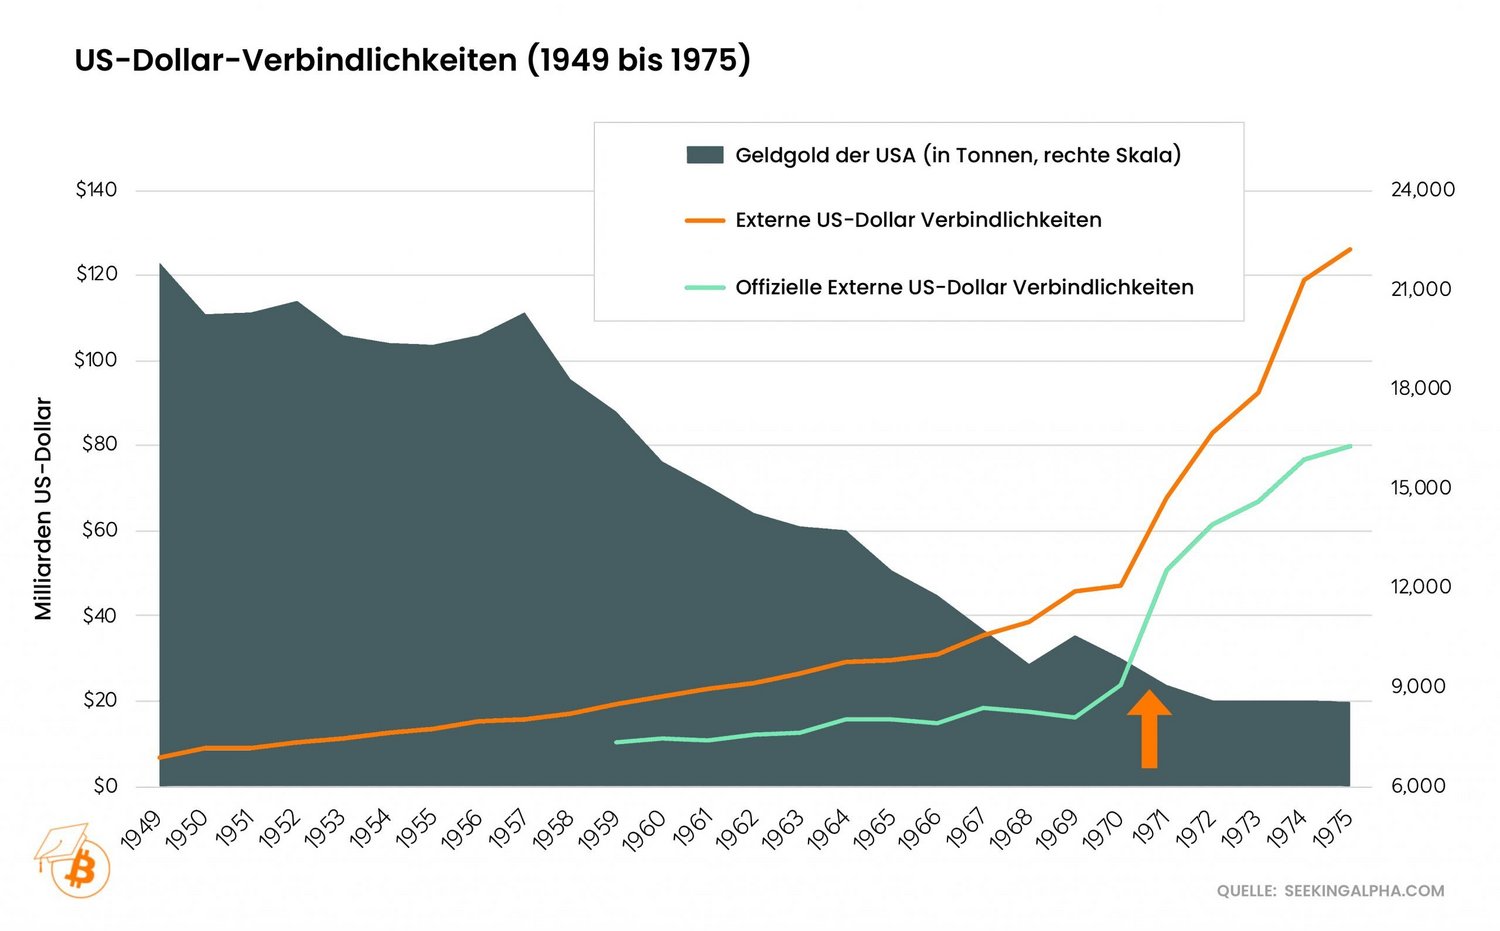
The fact that the USA increasingly imported goods from abroad can also be illustrated by the external US dollar liabilities. Since 1971, the USA has increasingly had payment obligations to foreign countries denominated in US dollars, which means that foreign countries increasingly hold US government bonds that were purchased with the US dollars that the USA exported in exchange for goods.
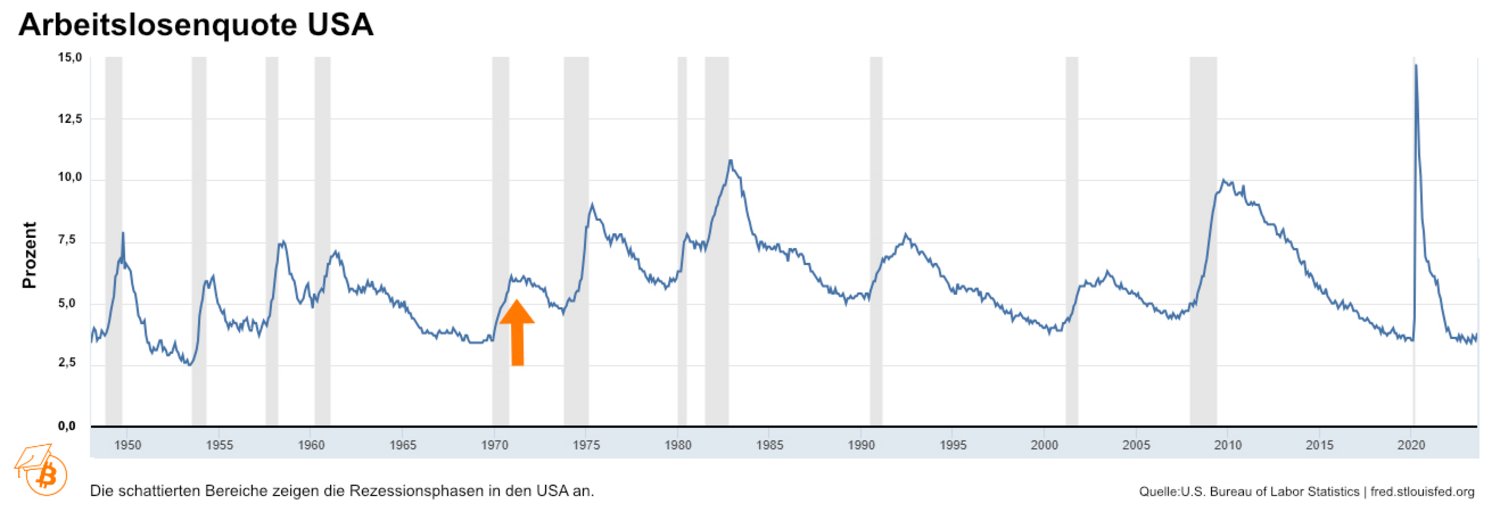
One mandate of the US central bank is to ensure maximum employment. Immediately after the abolition of the gold standard, however, the US unemployment rate rose to levels well above the highs of previous decades.
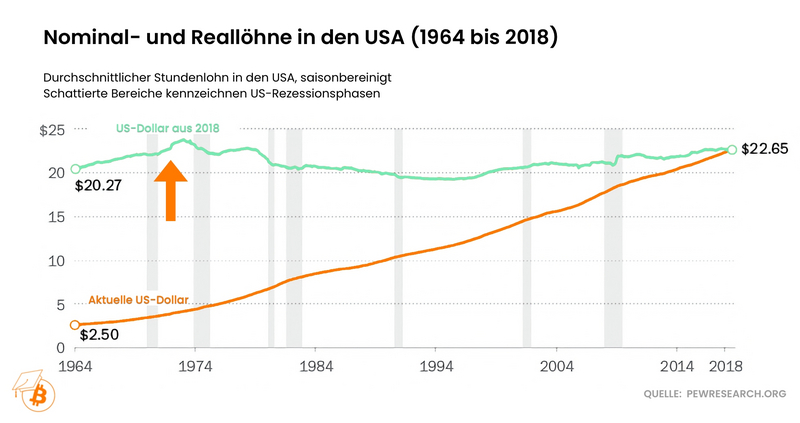
Developments in terms of wages are particularly worrying. Although wages have risen in nominal terms, if they are adjusted for inflation, they have been falling since 1971. In terms of purchasing power, Americans earn less on average every hour than they did at the end of the gold standard - real wages were still rising before 1971.
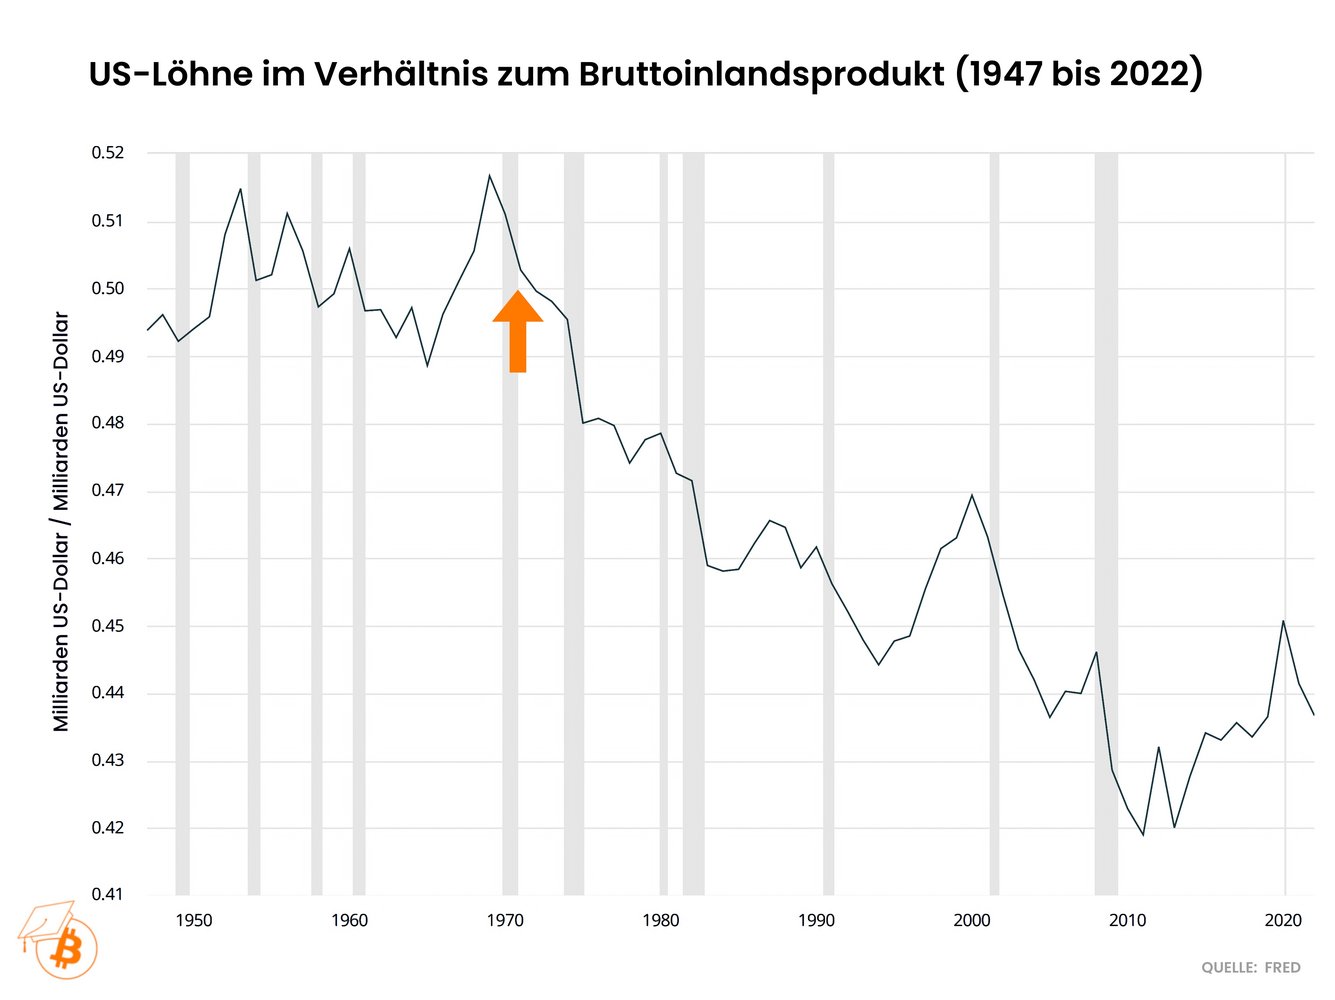
If the wages of US citizens are set in relation to US economic output, it becomes clear that a downward trend begins around 1971. The relative compensation of workers has therefore been falling steadily since the abolition of the gold standard - before that it remained at a significantly higher level for decades.
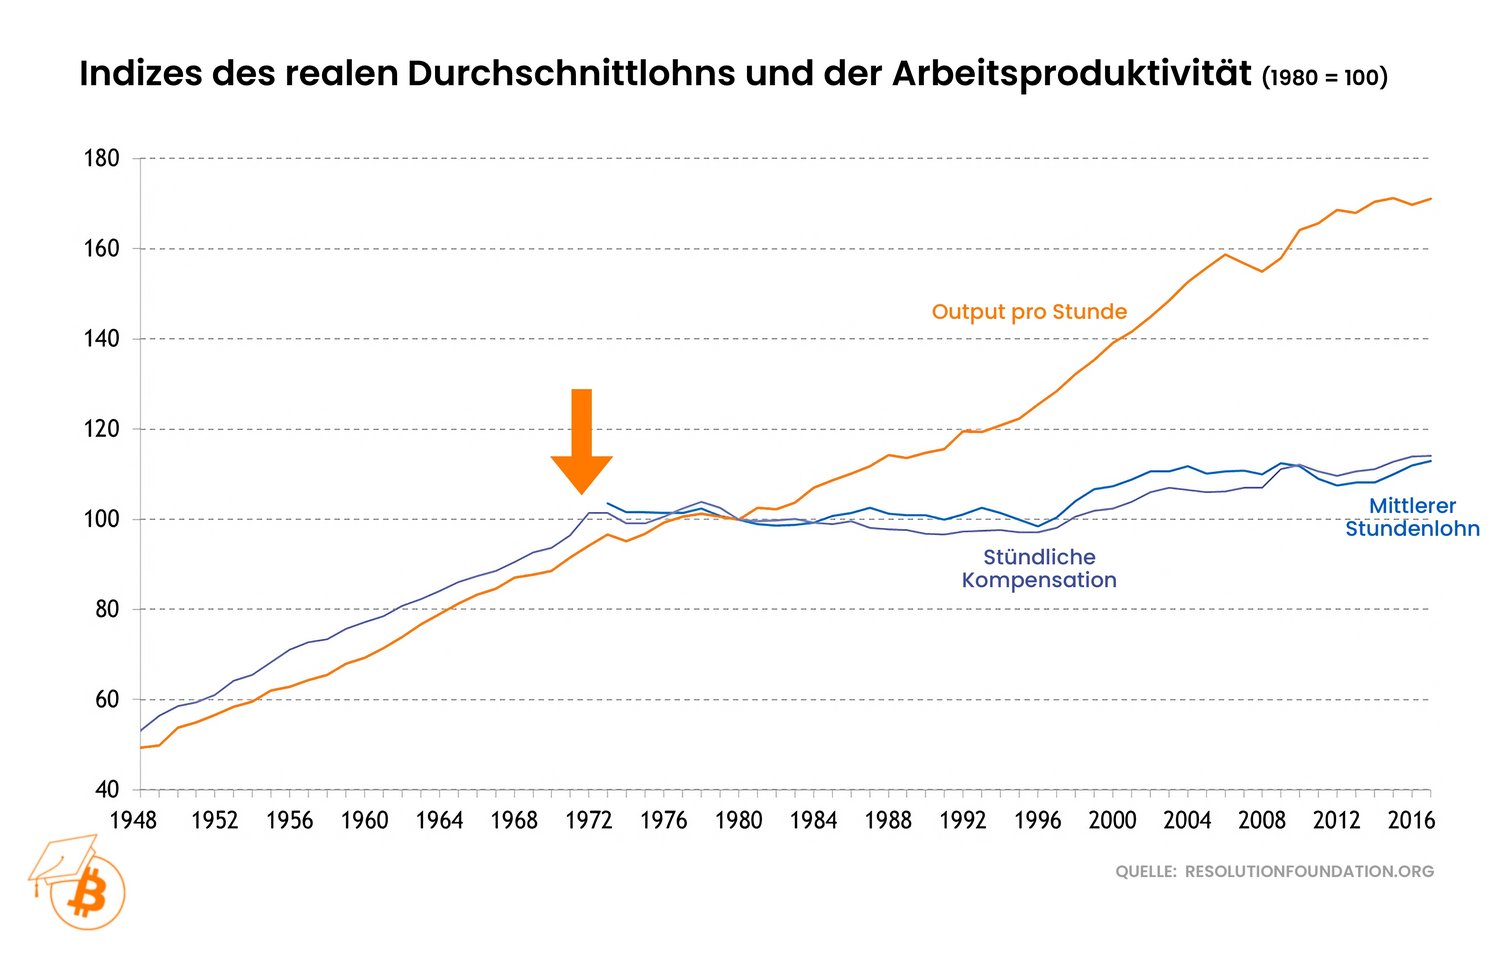
From another perspective, the problem becomes even clearer. During the gold standard, productivity rose in step with inflation-adjusted hourly wages. In 1971, however, the decoupling began: real wages stagnated while output continued to rise. In other words: workers receive less and less of the value of what is produced with the help of their working hours.
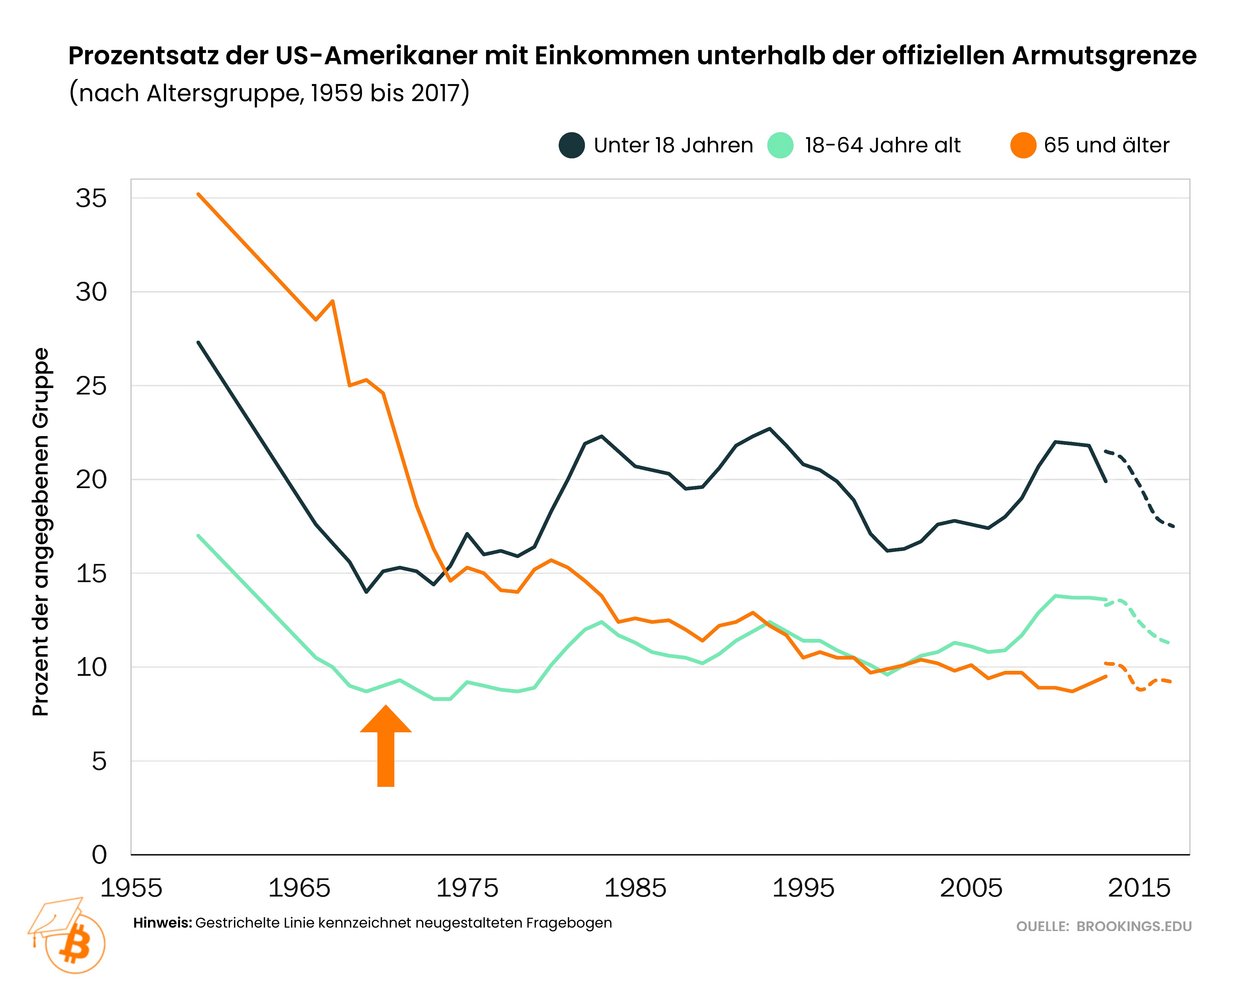
The fact that workers have been paid less and less since the end of the gold standard is also reflected in the poverty rate: until 1971, the percentage of Americans earning an income below the official poverty line fell dramatically. Then the trend began to change. The poverty rate rose again for children and has since stagnated for adults.
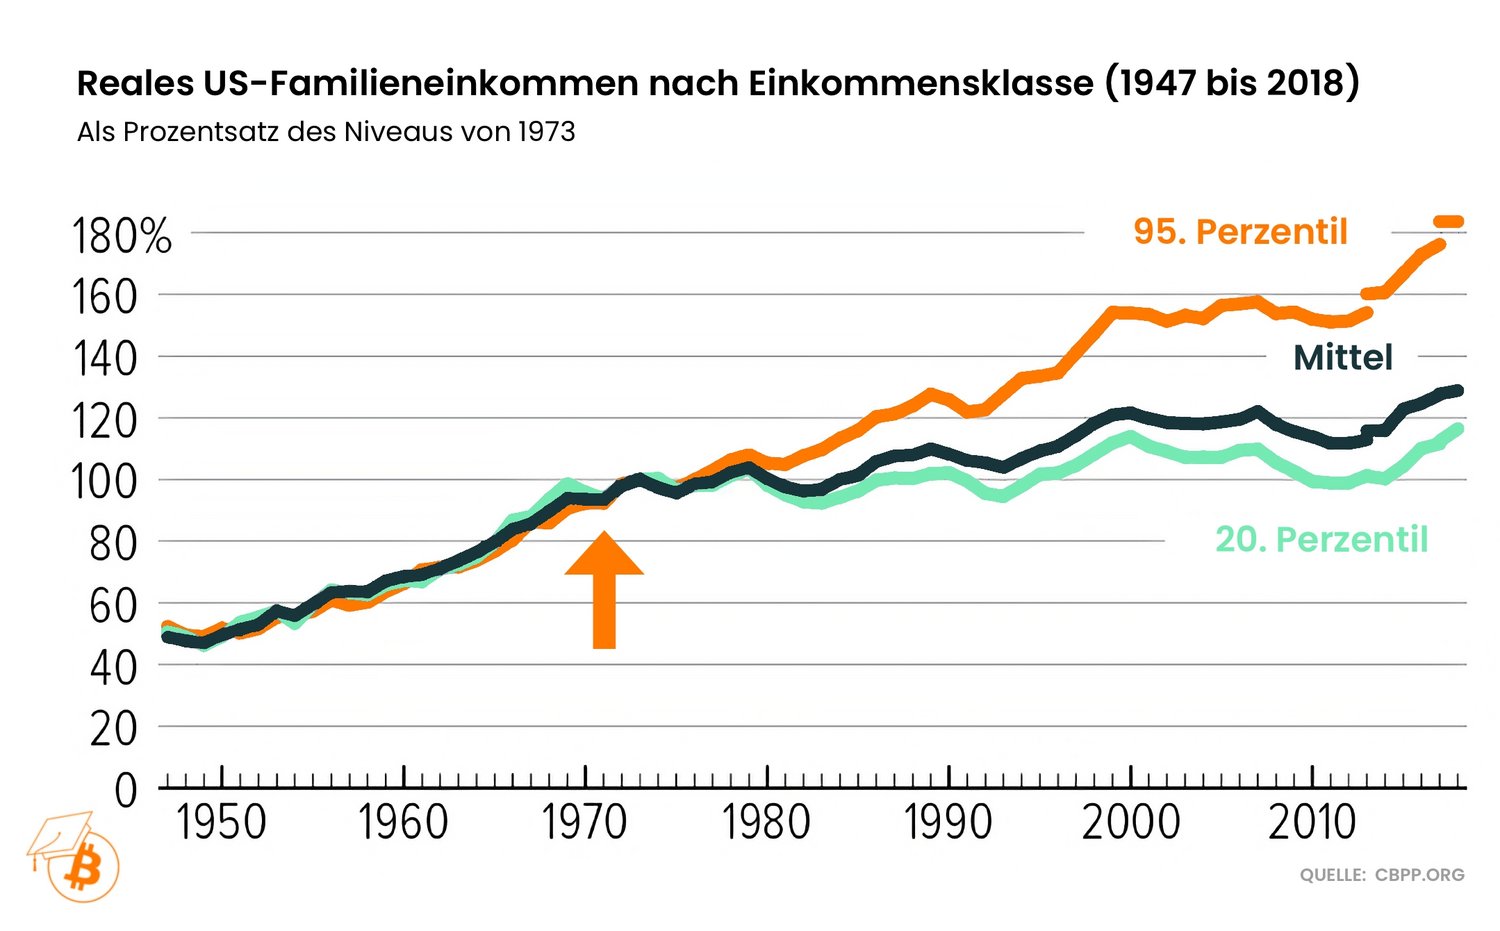
If we look at the real incomes of US families and categorize them by income class, we can see that income inequality has increased significantly since the end of the gold standard: The top 5% earners have been able to keep increasing their real income, while the real median income and especially the real income of the bottom 20% earners have tended to tread water. Before 1971, real incomes in the various income classes were still growing evenly.
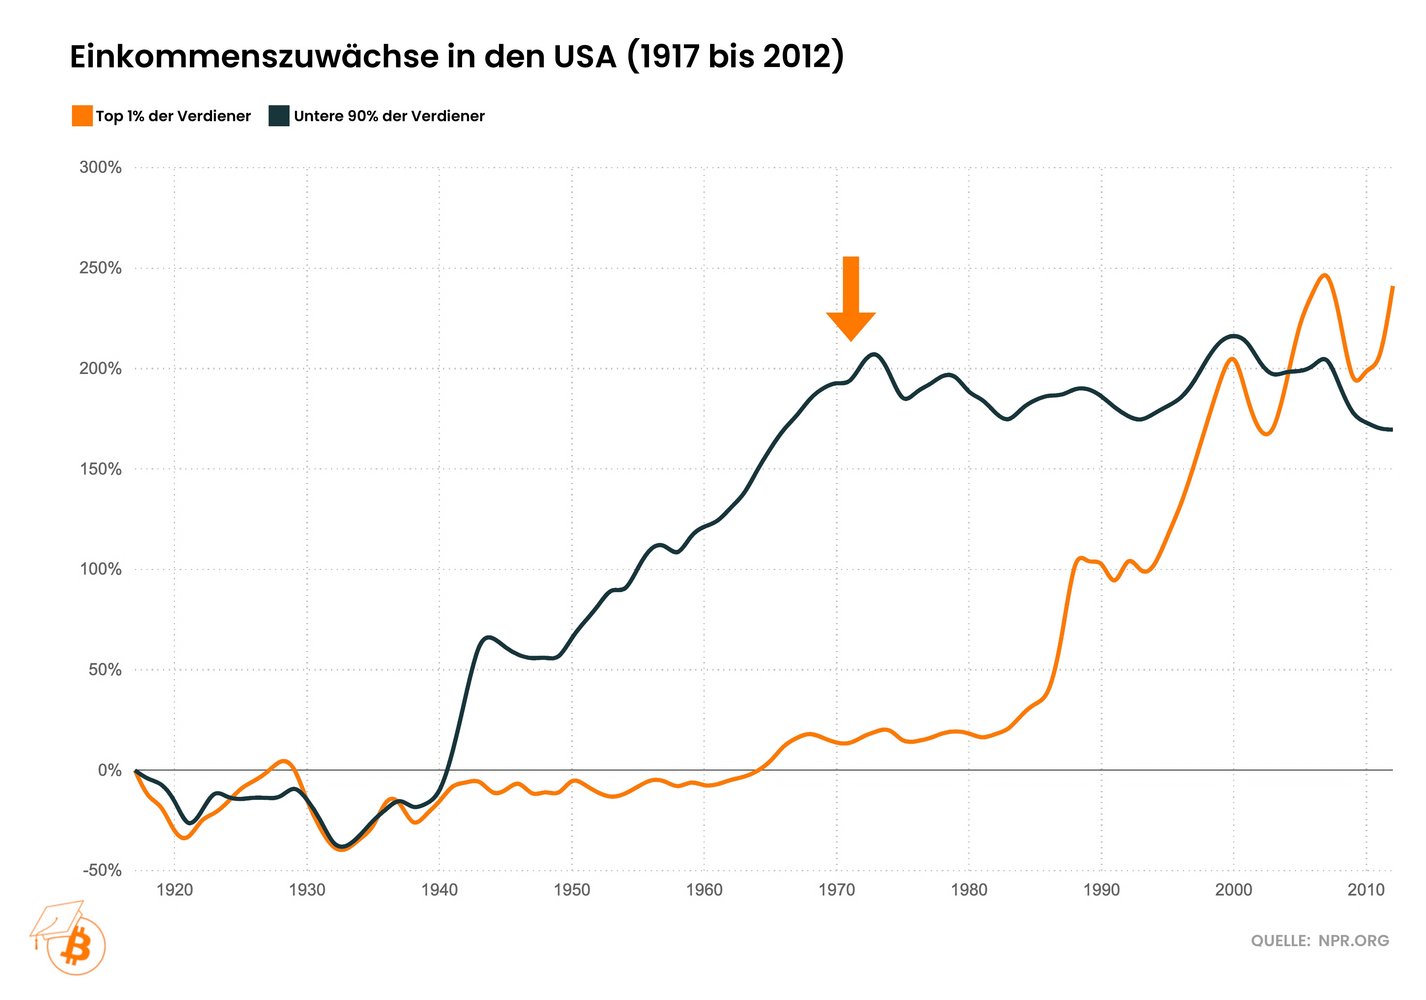
The discrepancy becomes even clearer when we look at the income growth of the super-rich in the US. After decades of stagnation, the real incomes of the top 1% of earners began to rise again after the abolition of the gold standard. The real incomes of the bottom 90% of earners have been stagnating since 1971, after decades of significant growth.
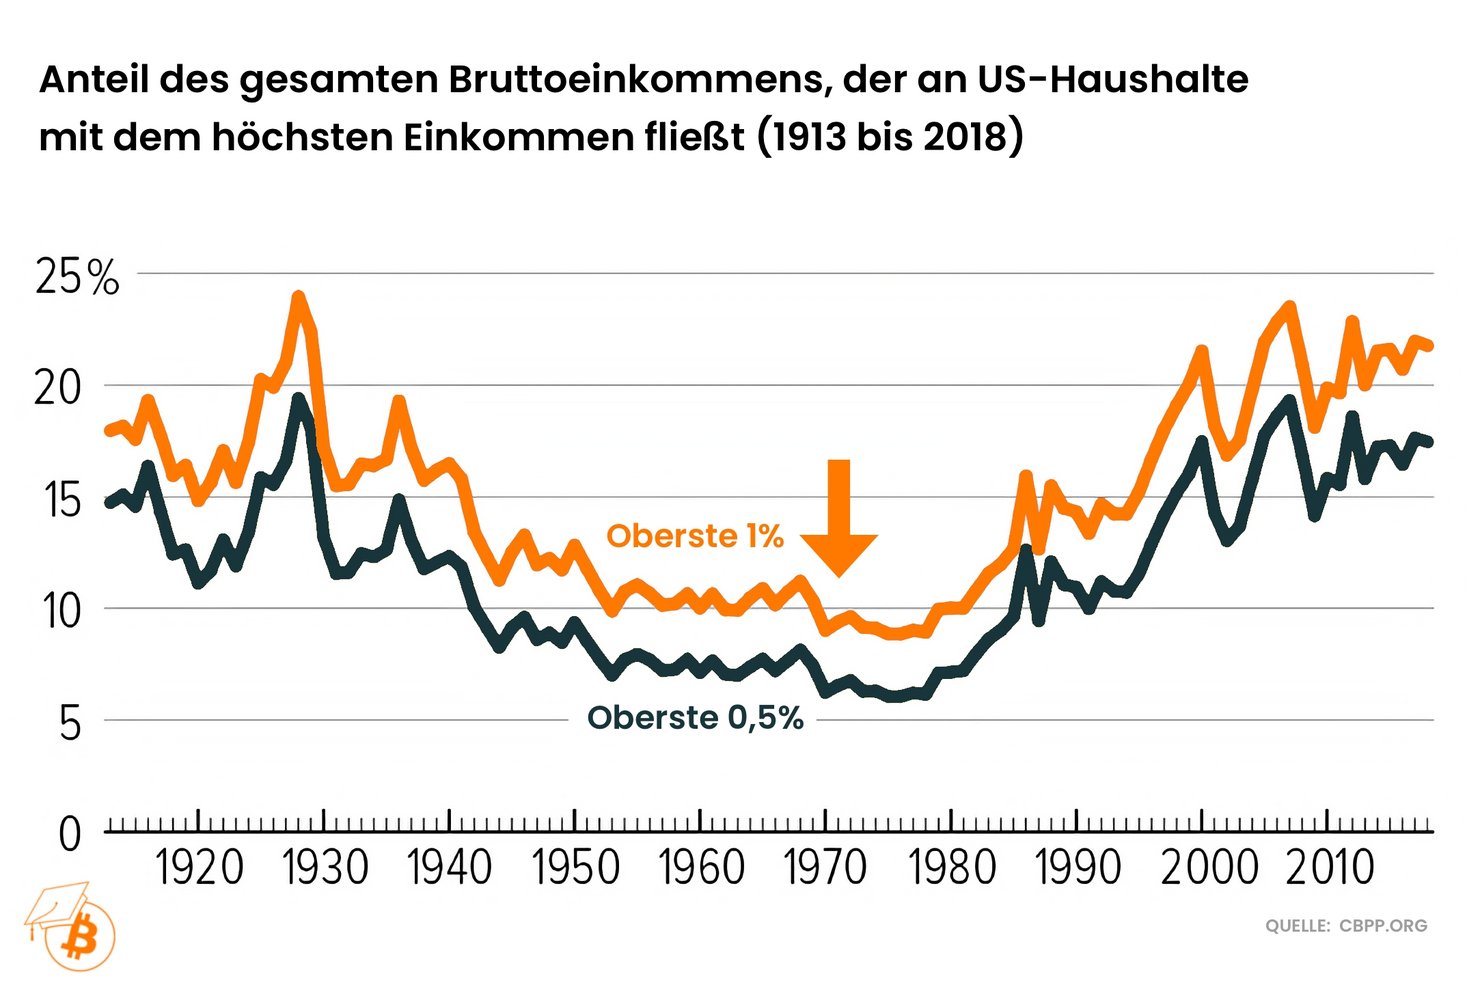
In other words, it is also easy to see that the trend change in income inequality took place around 1971. Since then, the richest 0.5% or 1% (measured by household income) have accounted for an ever-increasing share of total income.
In 1971, the top 1% of earners accounted for just under 10% of gross household income - now it is over 20%.
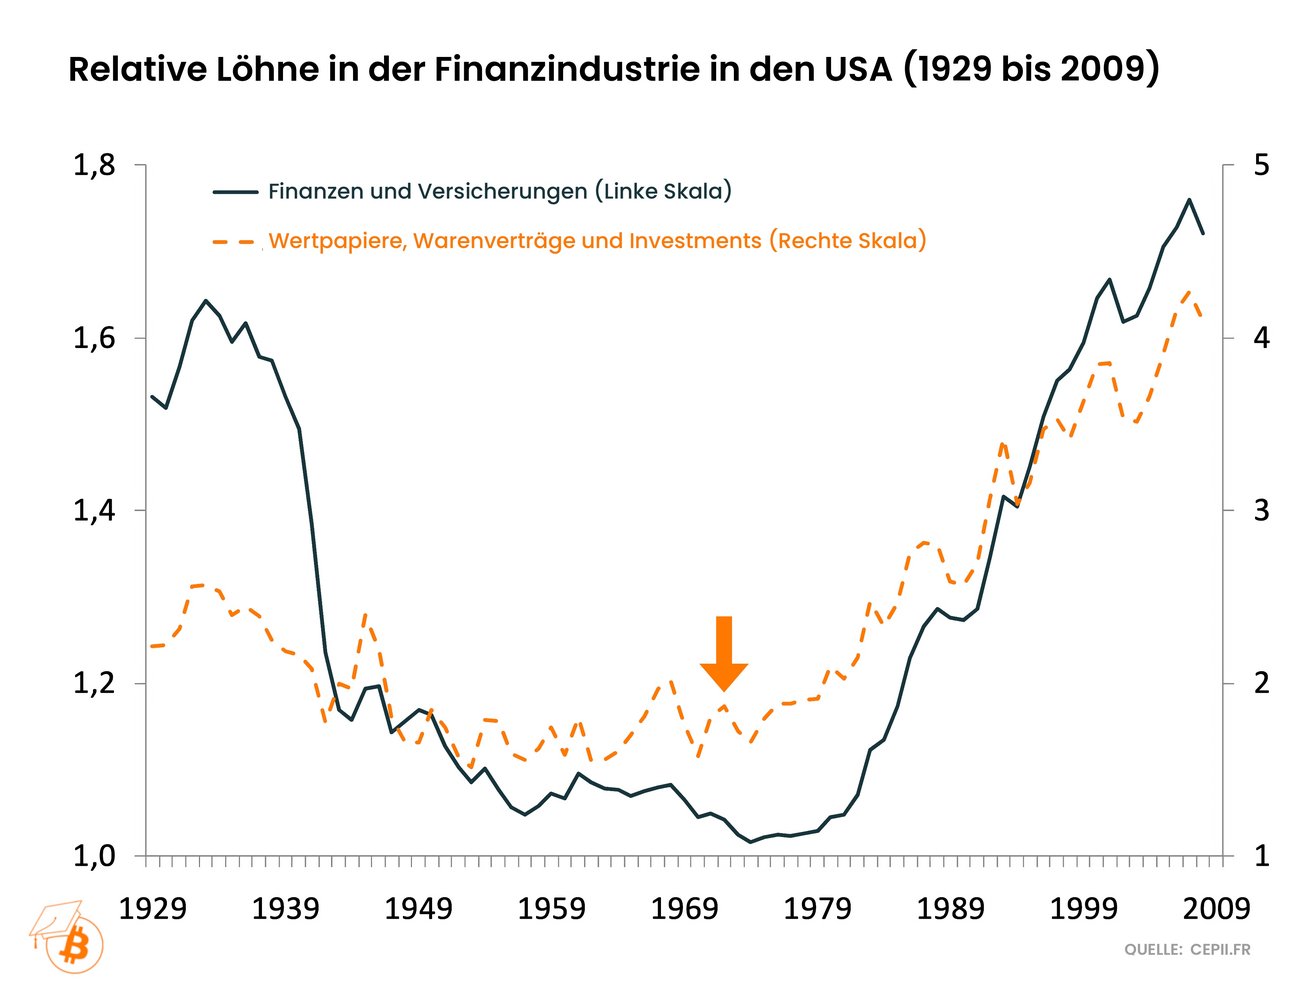
Interestingly, an almost identical picture emerges when you look at wages in the finance and investment industry. Since the end of the gold standard, an increasingly large proportion of total US wages is once again being paid to people working in the financial market.
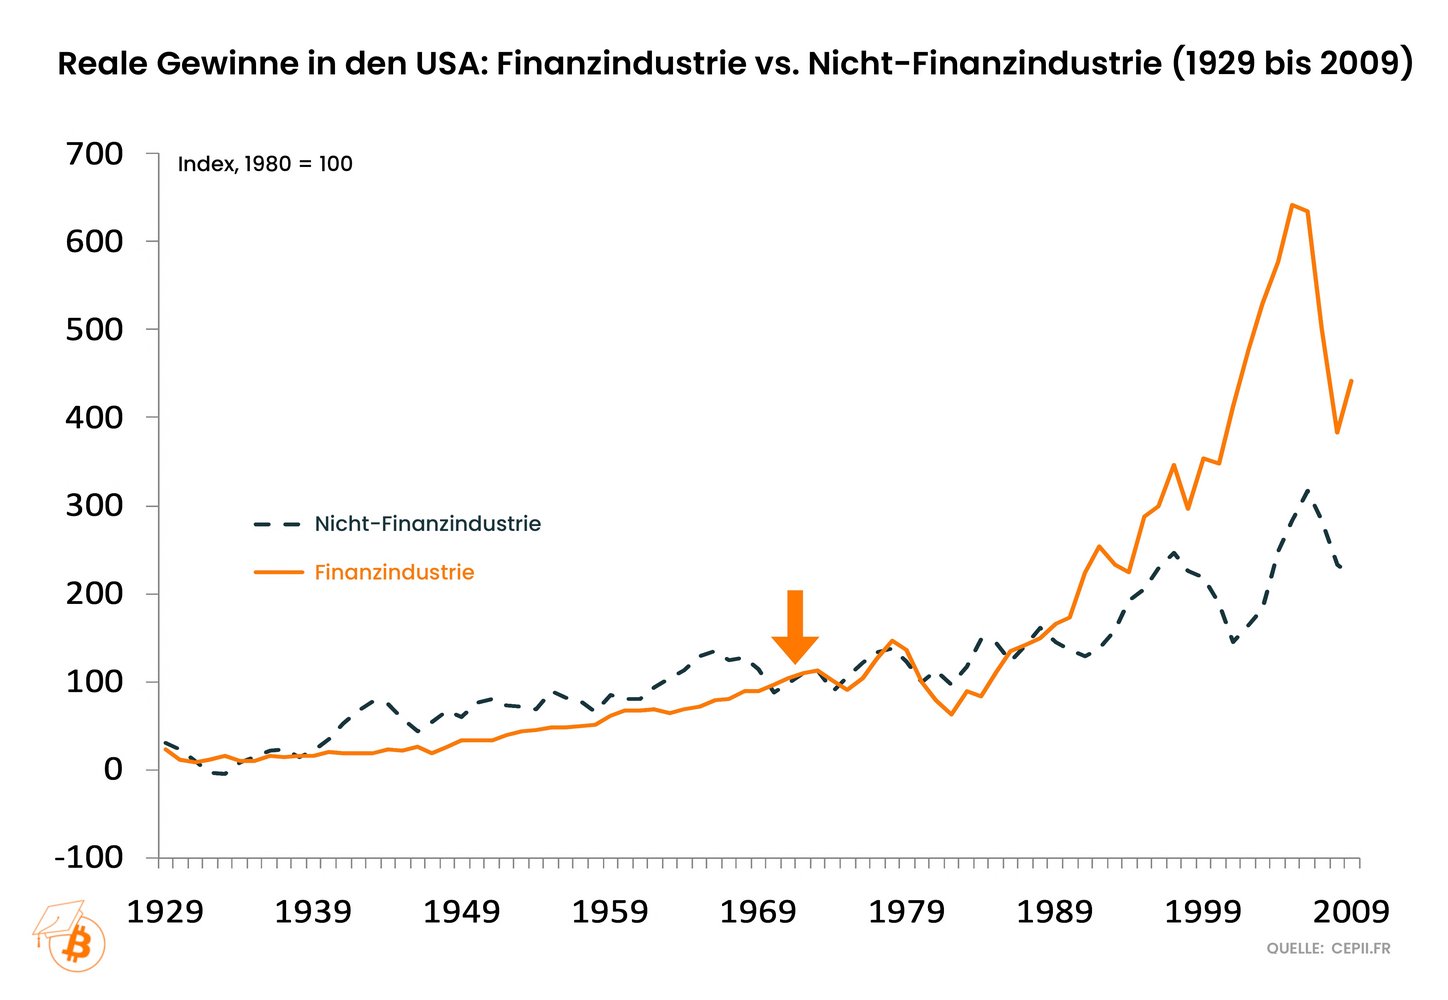
The fact that such good wages could be paid in the financial industry also seems to be due to the fact that profits in this very industry were able to grow faster than in other industries. Decoupling begins around the end of the gold standard.
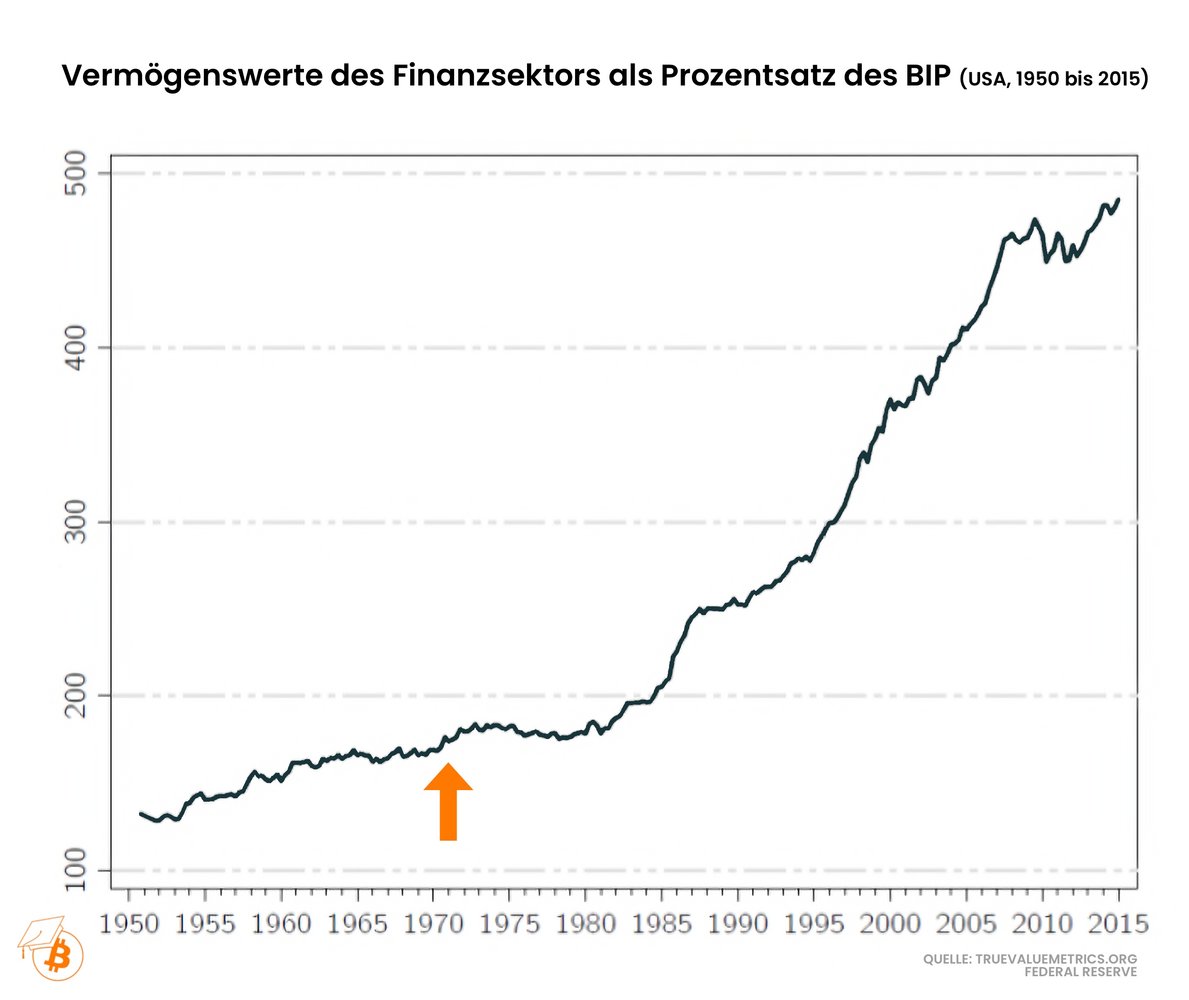
The fact that the financial sector fared so well seems to be directly related to the fact that it held the assets that benefited greatly from inflation. The value of financial sector assets literally exploded immediately after the end of the gold standard - also in relation to US economic output. During the gold standard, this increase was much more moderate.
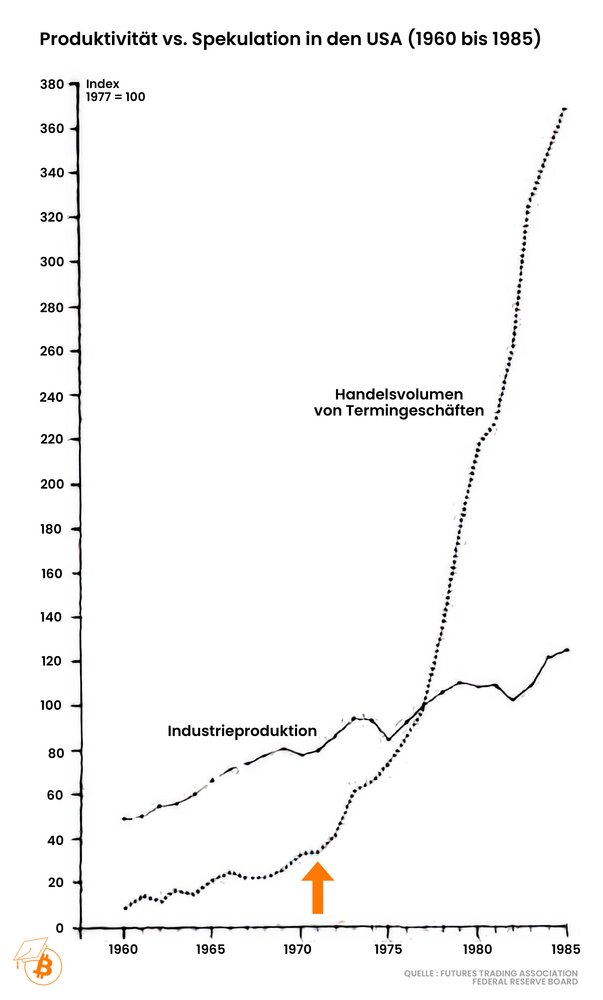
On the other hand, the financial industry will certainly have benefited from the fact that people have increasingly had to speculate on the financial markets so that their savings are not eaten up by inflation.
According to the following chart, volumes on the futures markets have risen sharply since the end of the gold standard, while industrial production has remained on its previous trend.
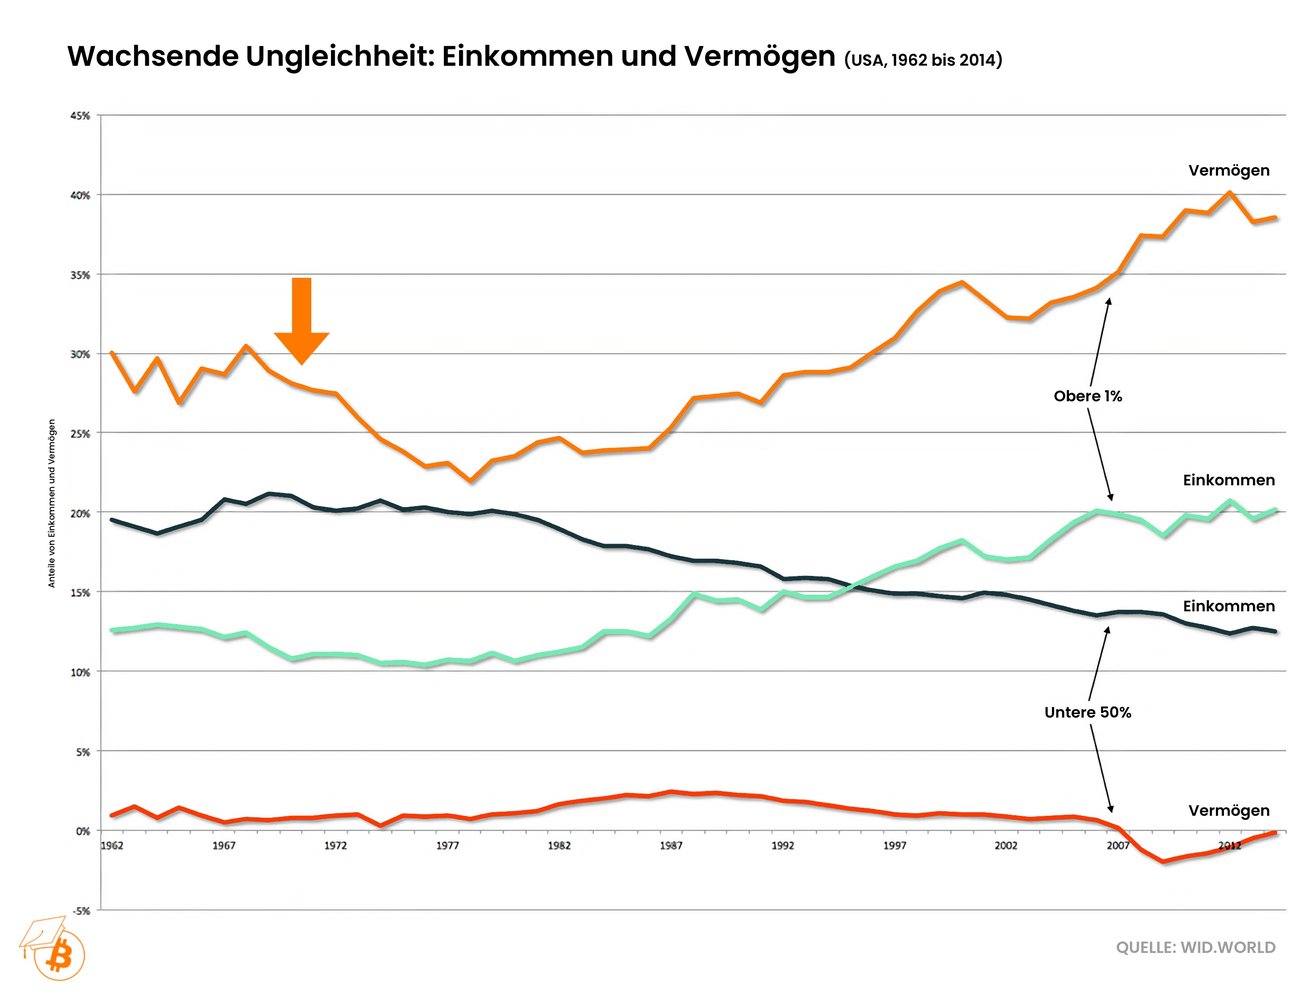
It should come as no surprise at this point that, in addition to income inequality, wealth inequality in the US has also increased since then.
The richest 1 percent not only account for an ever-increasing share of wages, but also of total US household wealth. The respective shares of the poorest 50 percent have decreased accordingly since the end of the gold standard.
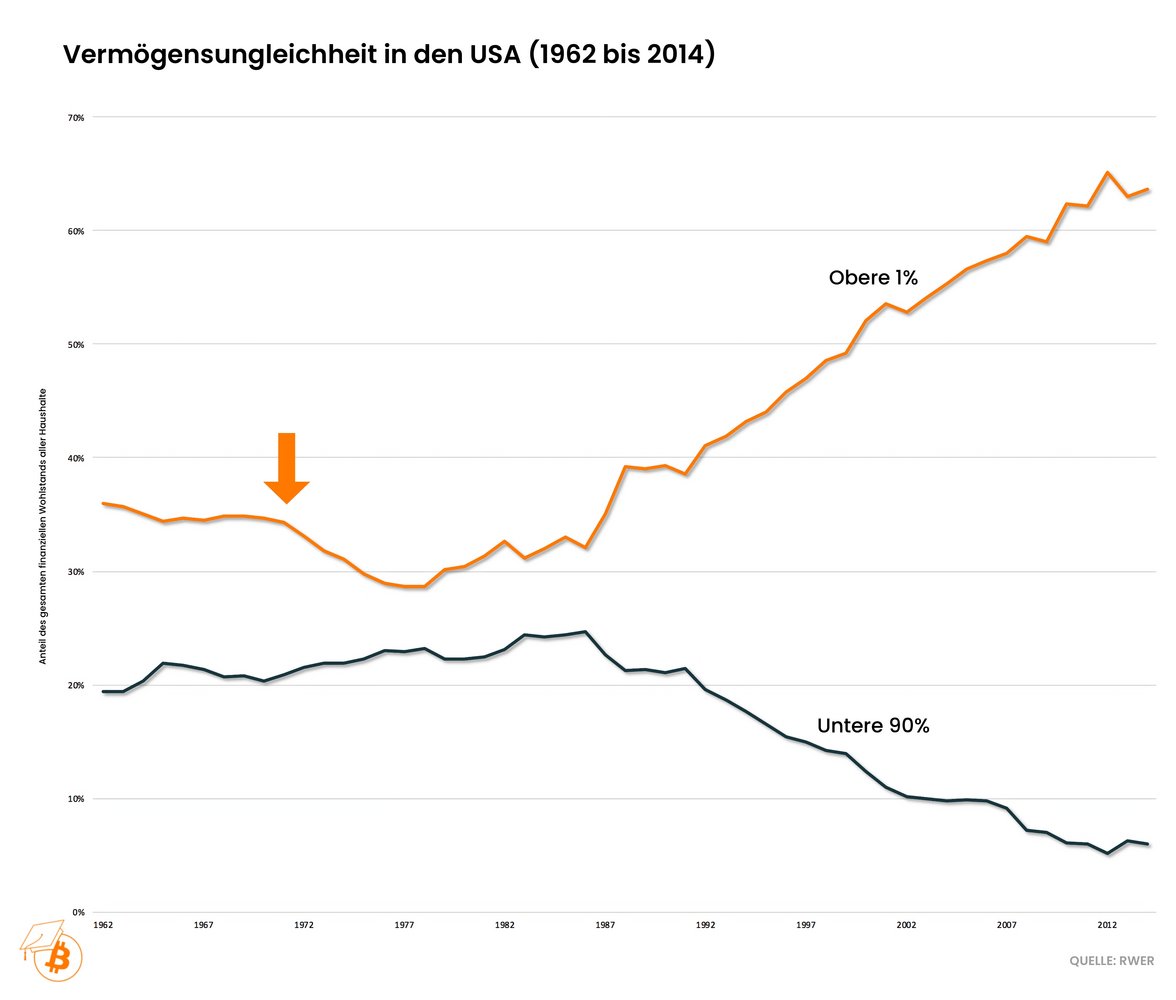
The share of total US household wealth held by the poorest 90 percent has also declined significantly since the end of the gold standard. Ultimately, only the super-rich seem to benefit financially from unbacked paper money and not the majority of the population.
The fact that the super-rich are getting richer can be explained on the one hand by the fact that they own assets that benefit from inflation and that they can also take on debt for investments at good conditions, which lose value due to inflation. In addition, the Cantillon effect comes into play here, which explains that those who are close to money creation benefit most from it.
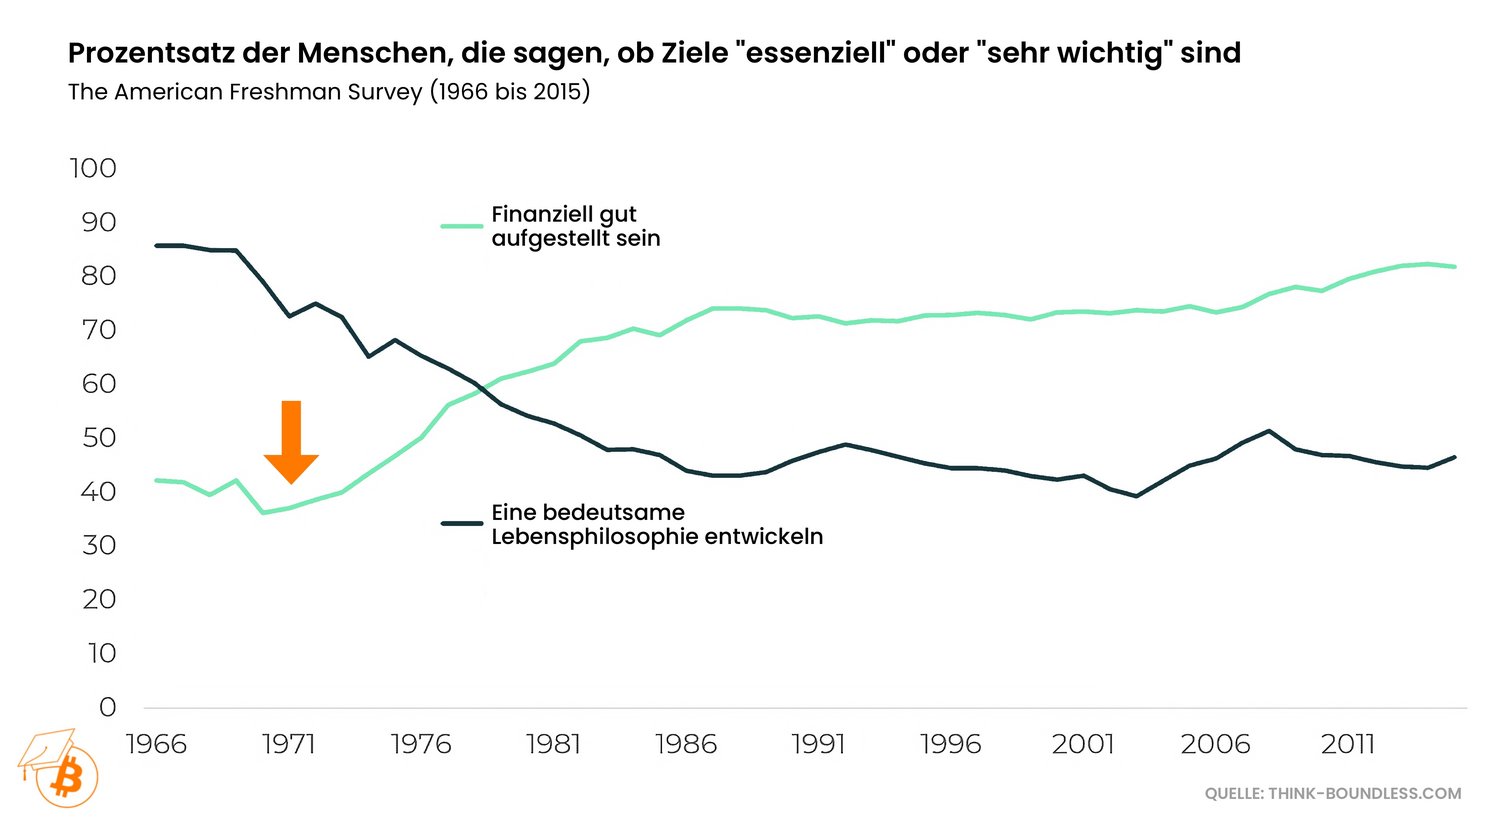
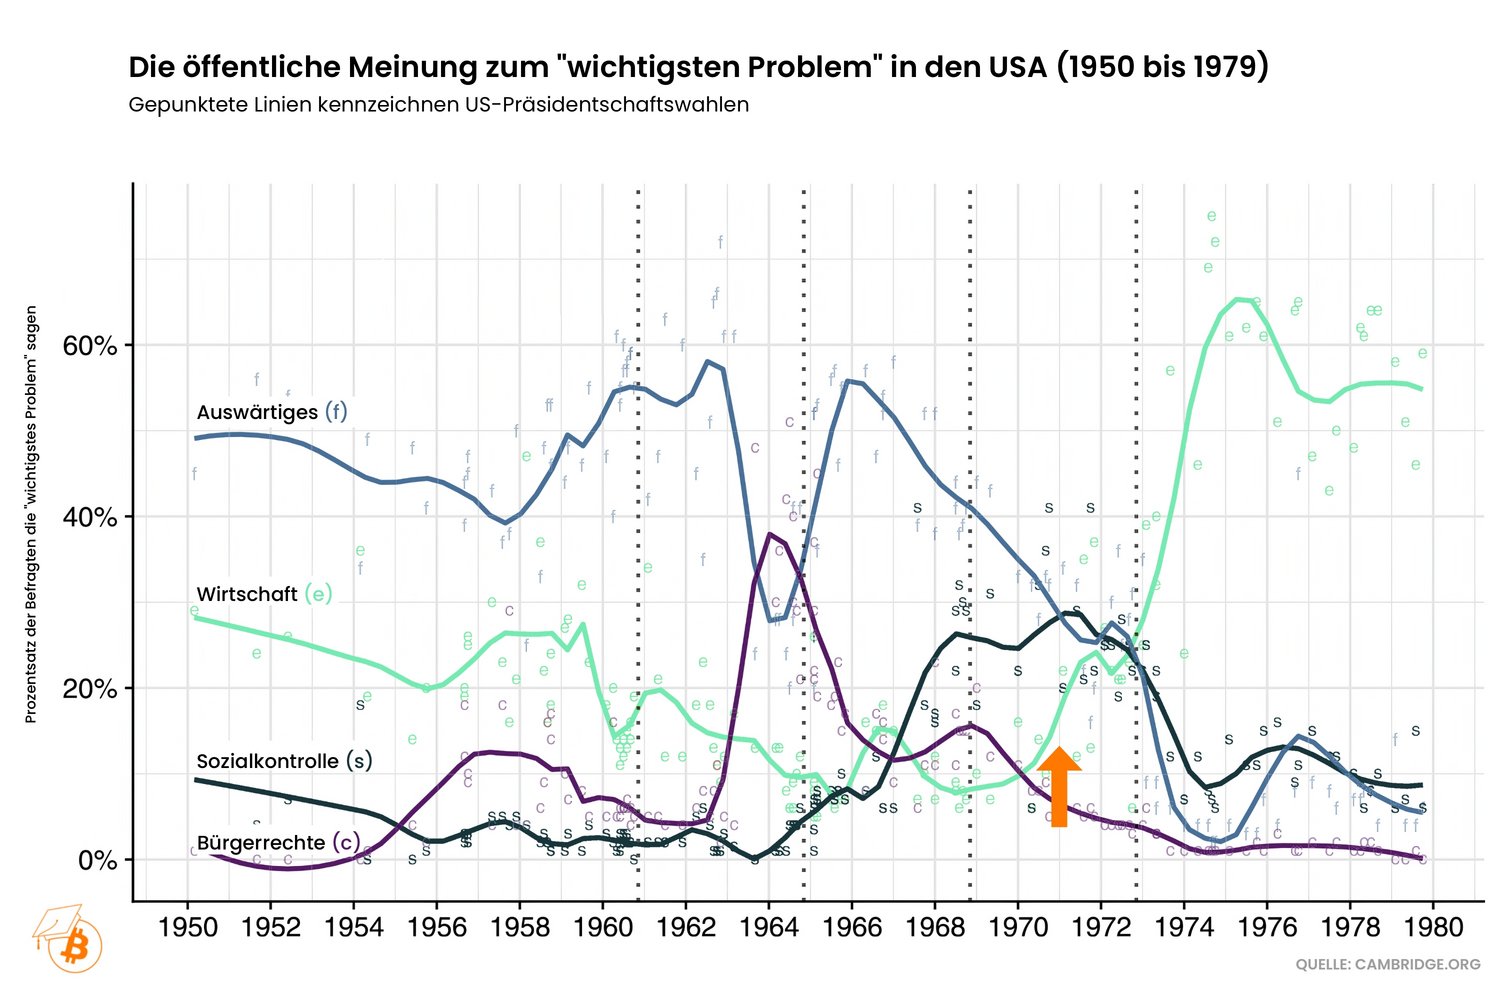
Since the majority of US citizens have been holding a smaller and smaller share of total wealth and are able to buy less and less with their income, it is economic issues that are increasingly preoccupying them.
Since the end of the gold standard, more and more Americans have stated that it is important to them to be financially well positioned. At the same time, it is increasingly unimportant for them to develop a meaningful philosophy of life.
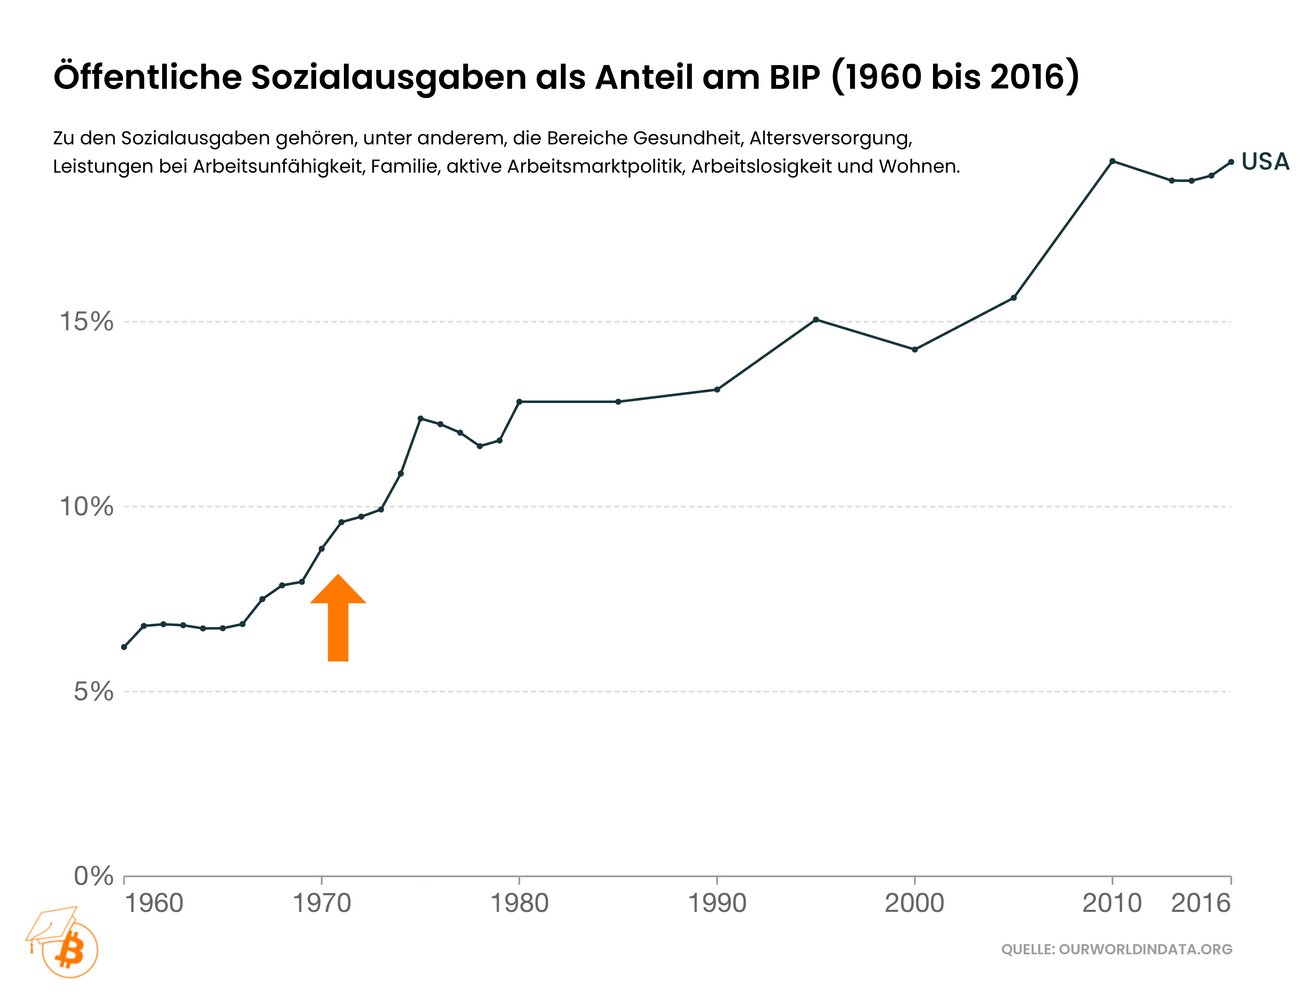
It doesn't seem to help that US social spending as a proportion of economic output has continued to rise ever since.
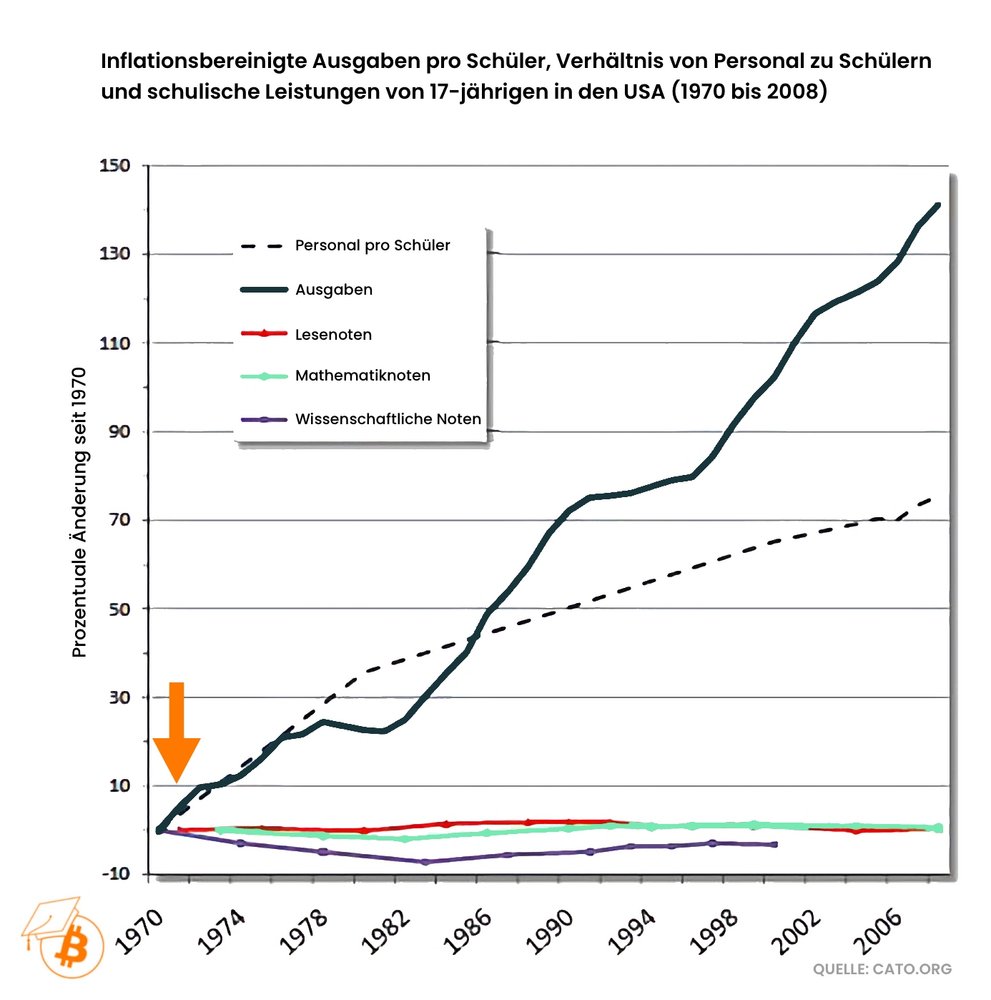
Since the end of the gold standard, not only social spending but also education spending appears to have increasingly failed to have the desired effect.
In the USA, more and more money has been spent on the education of pupils since 1971, adjusted for inflation. There has also been an ever-increasing ratio of staff to pupils. At the same time, however, there has been no real improvement in the performance of young Americans in reading, math and science.
The fact that the middle class in the USA has been experiencing increasing financial difficulties since 1971 - despite rising social spending - is also made clear by the following facts.
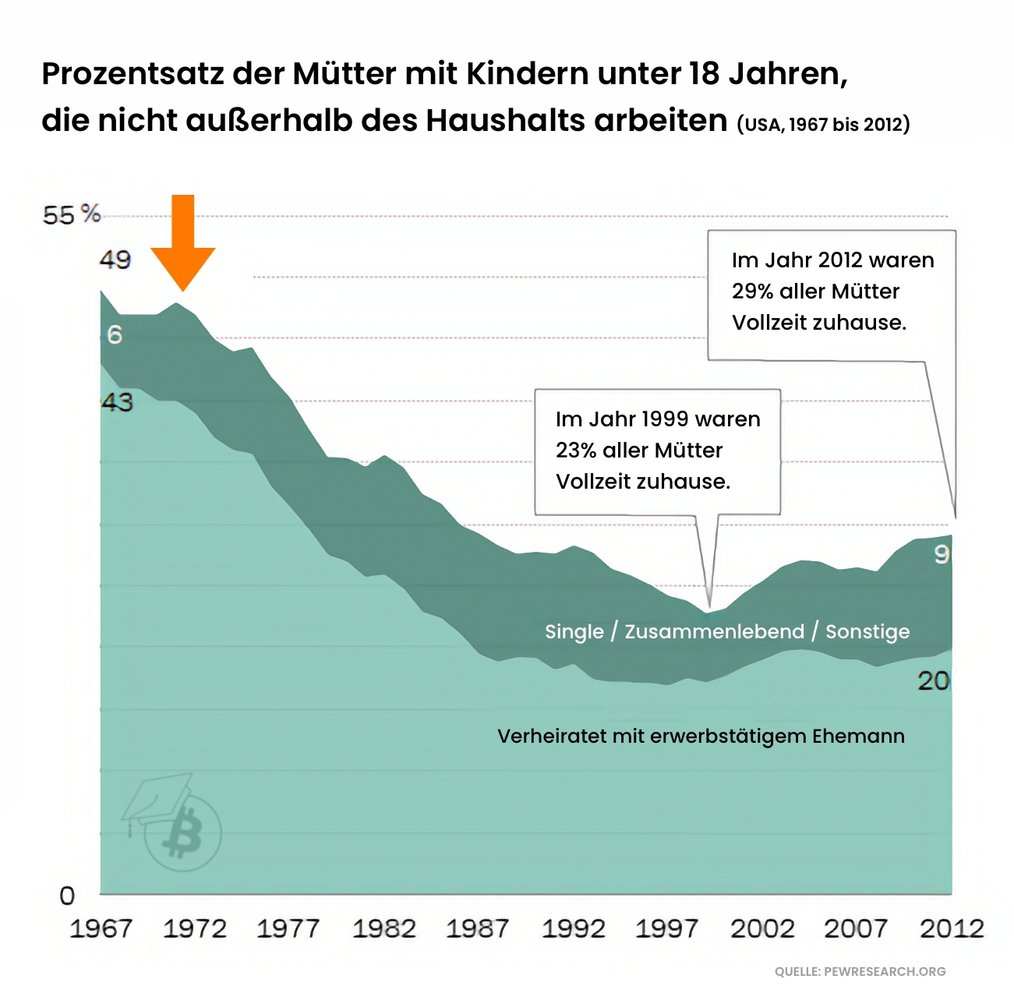
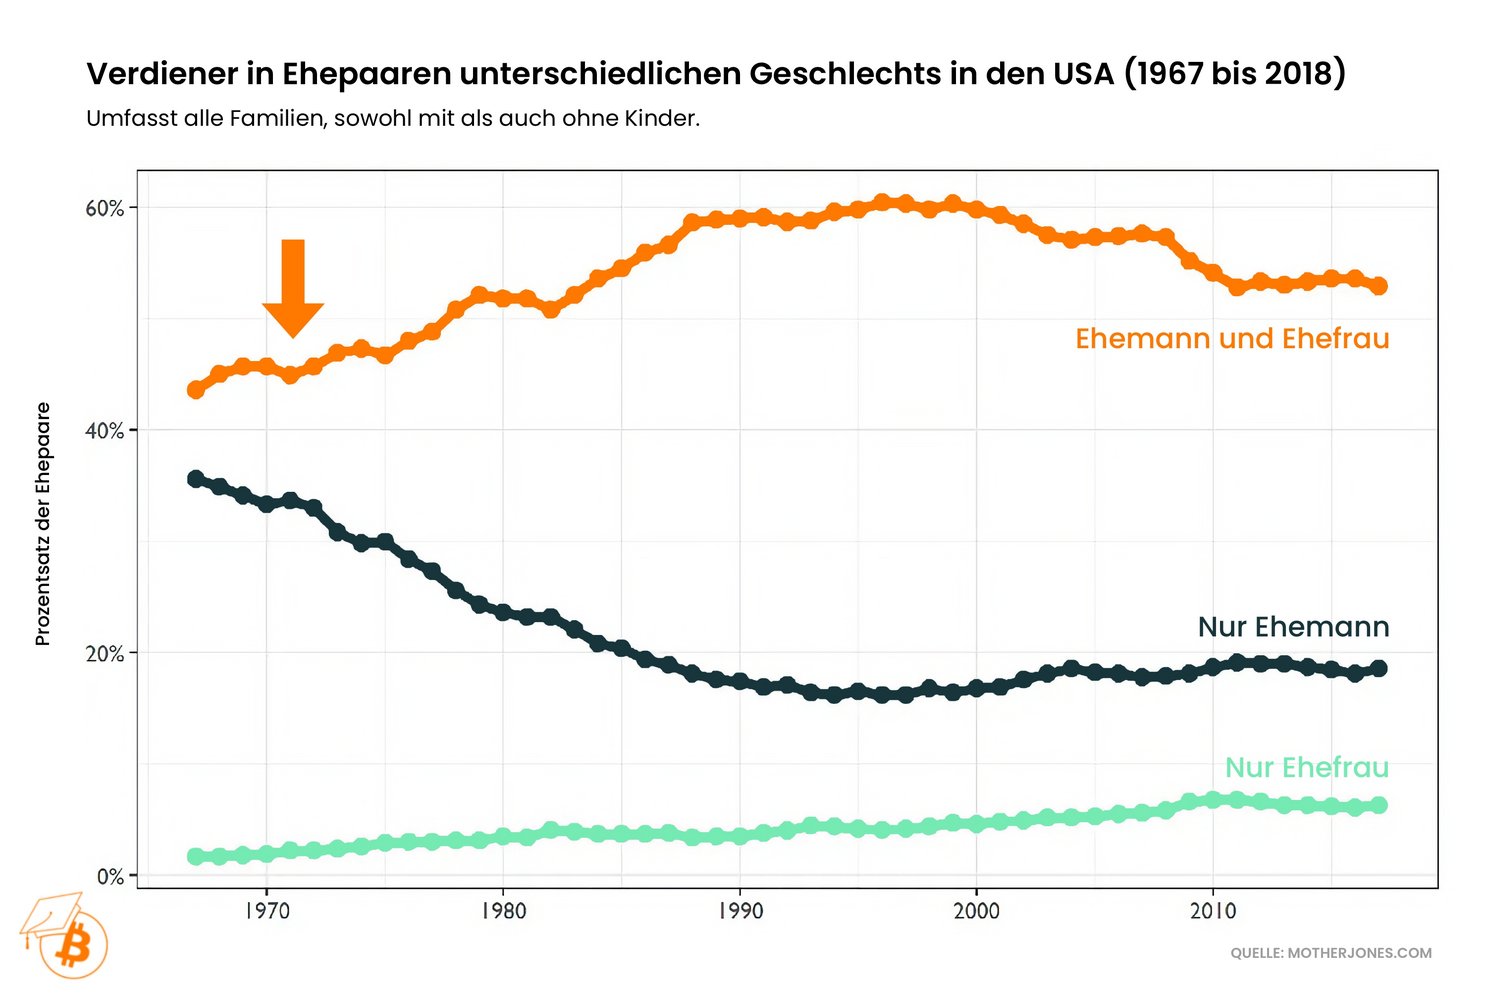
Since the end of the gold standard, it seems to be less and less sufficient for only the husband to earn the money. Accordingly, it is increasingly common for both husband and wife to go out to work.
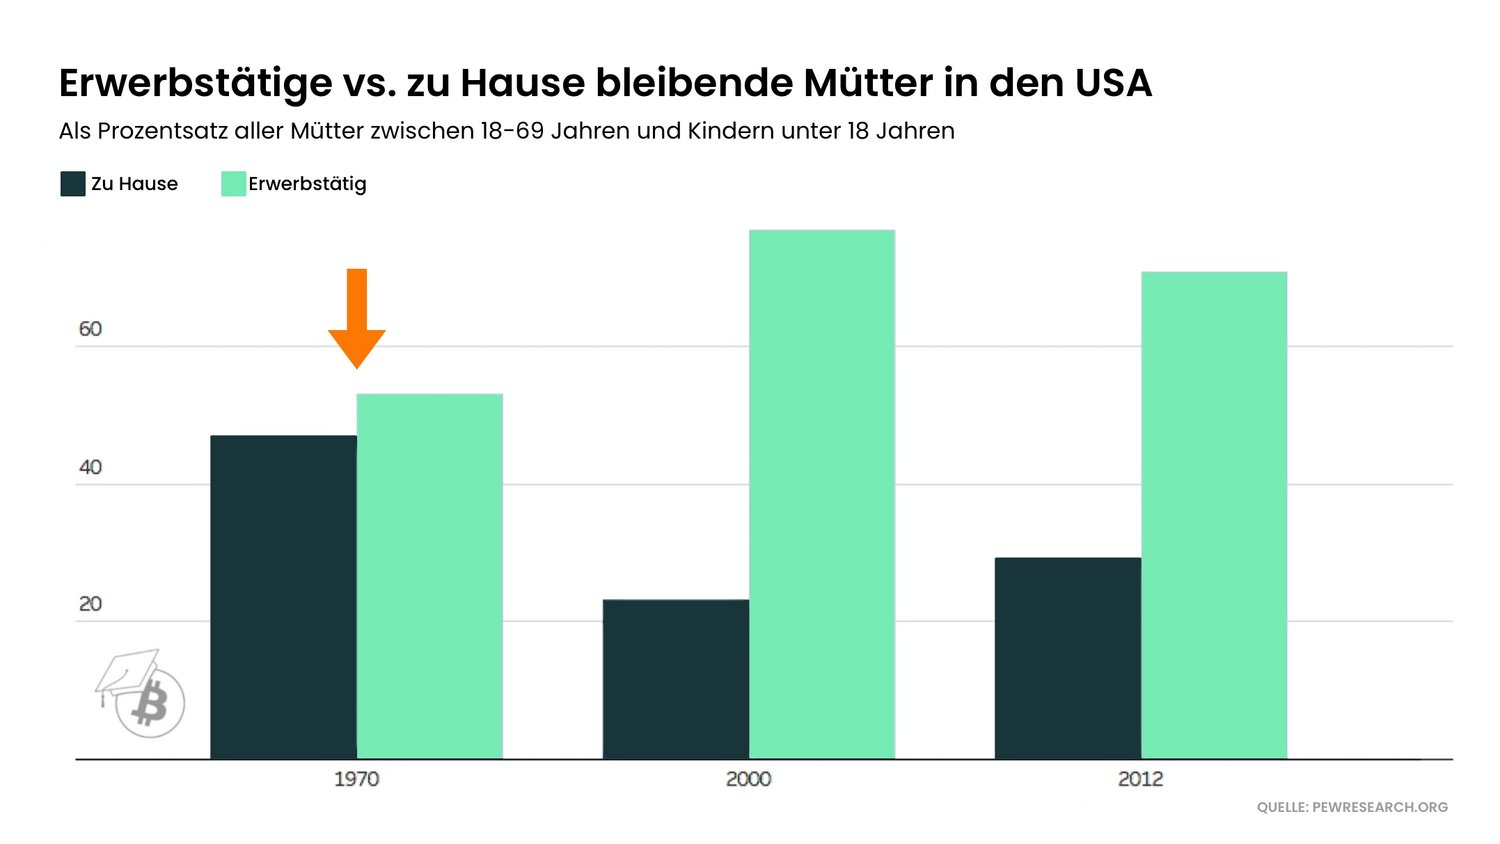
Put another way: Whereas towards the end of the gold standard, just under 50% of US mothers were able to stay at home with their children instead of having to earn money, a few decades later this figure has fallen to just over 20%.
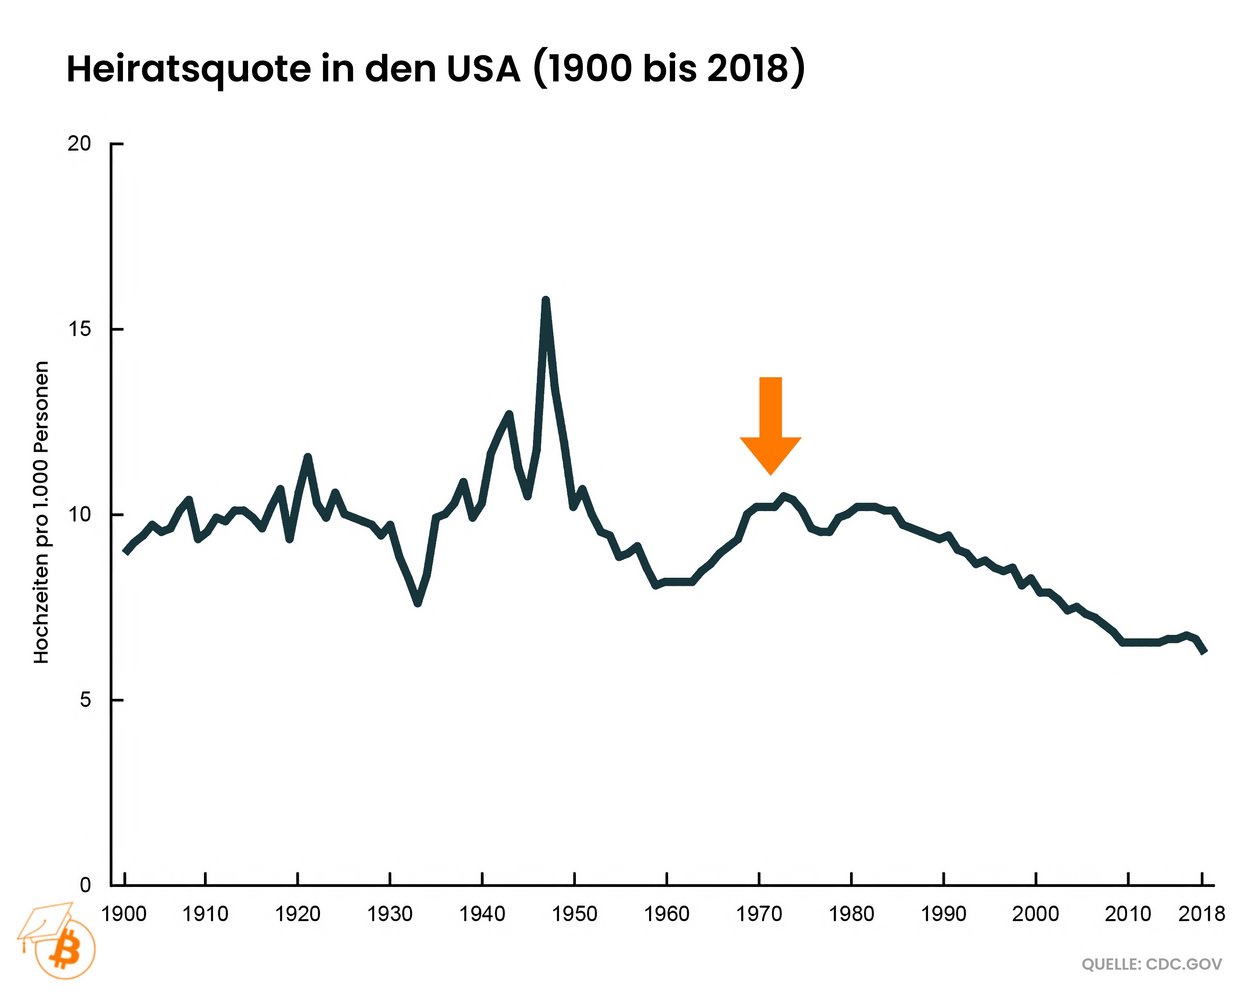
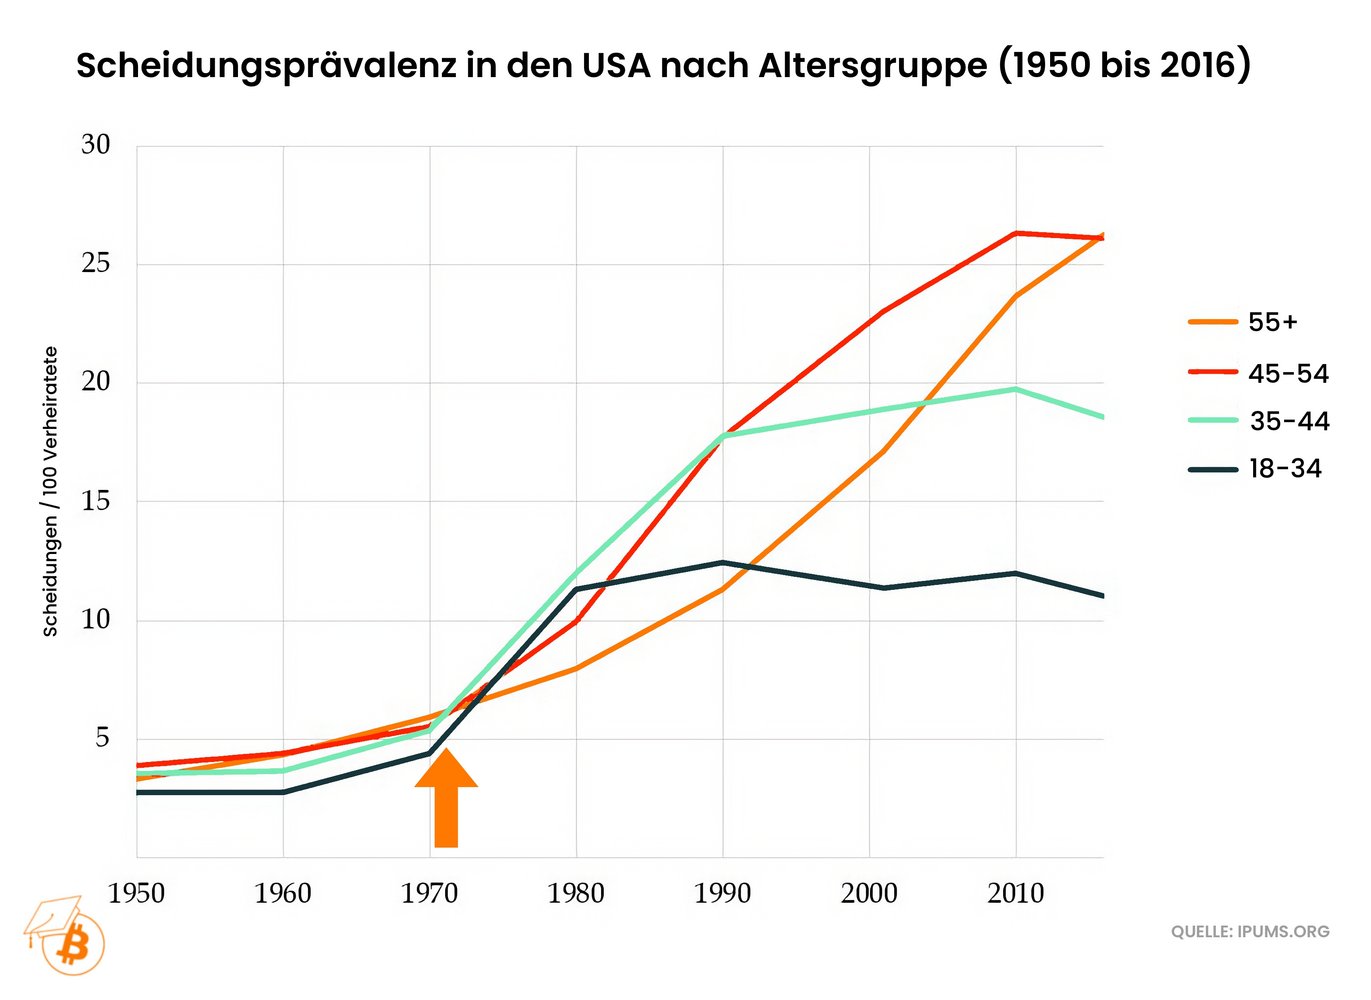
If people have to work more and more to make ends meet, it is hardly surprising that fewer and fewer marriages are being entered into or maintained at the same time. The US marriage rate began to fall significantly in 1971, having previously risen.
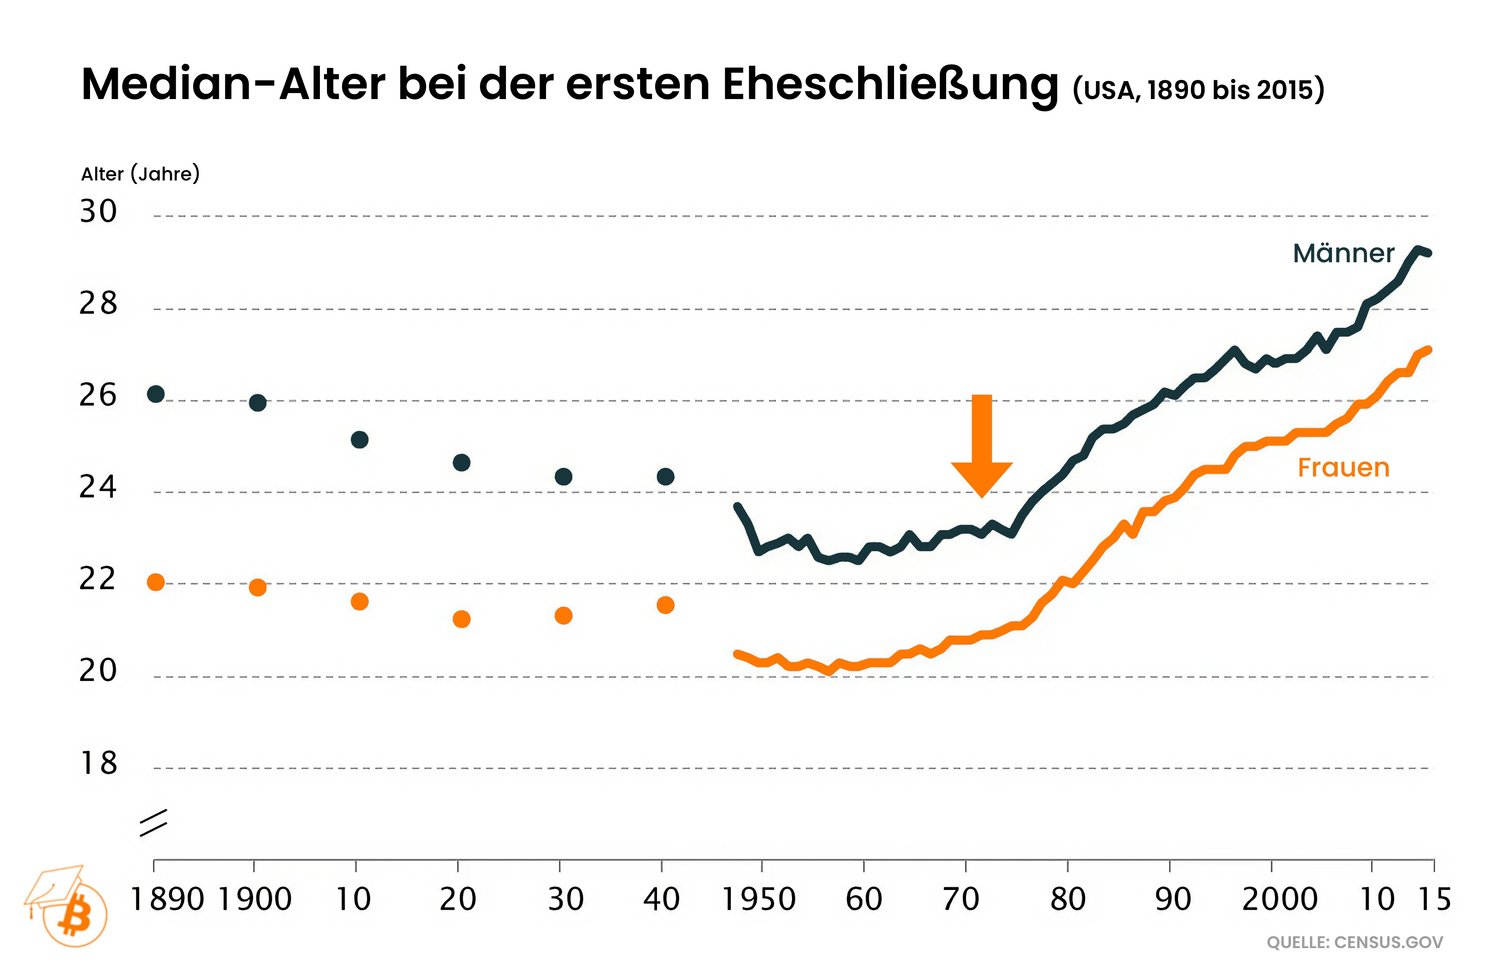
In other words, the change in marriage trends is also very clear: the median age of Americans at first marriage has risen sharply since the end of the gold standard.
This seems to be partly due to the fact that young adults in particular were increasingly financially worse off.
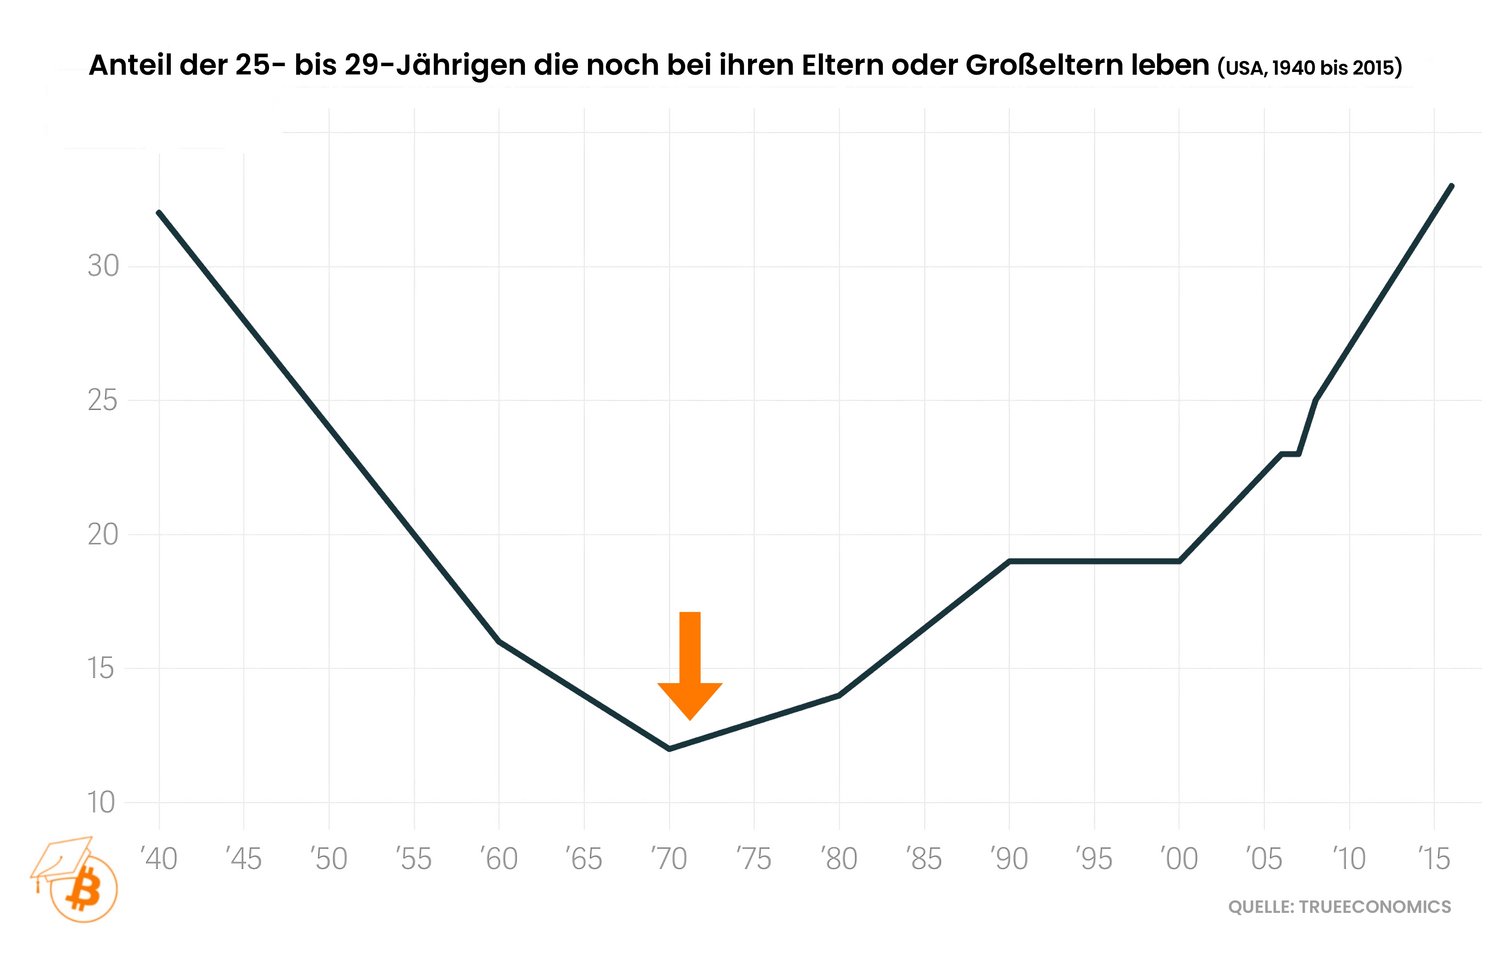
It is therefore not surprising that more and more young adults in the USA had to stay with their parents.
The proportion of young adults living with their parents had been declining for decades before 1971. Since then, it has been rising again significantly.
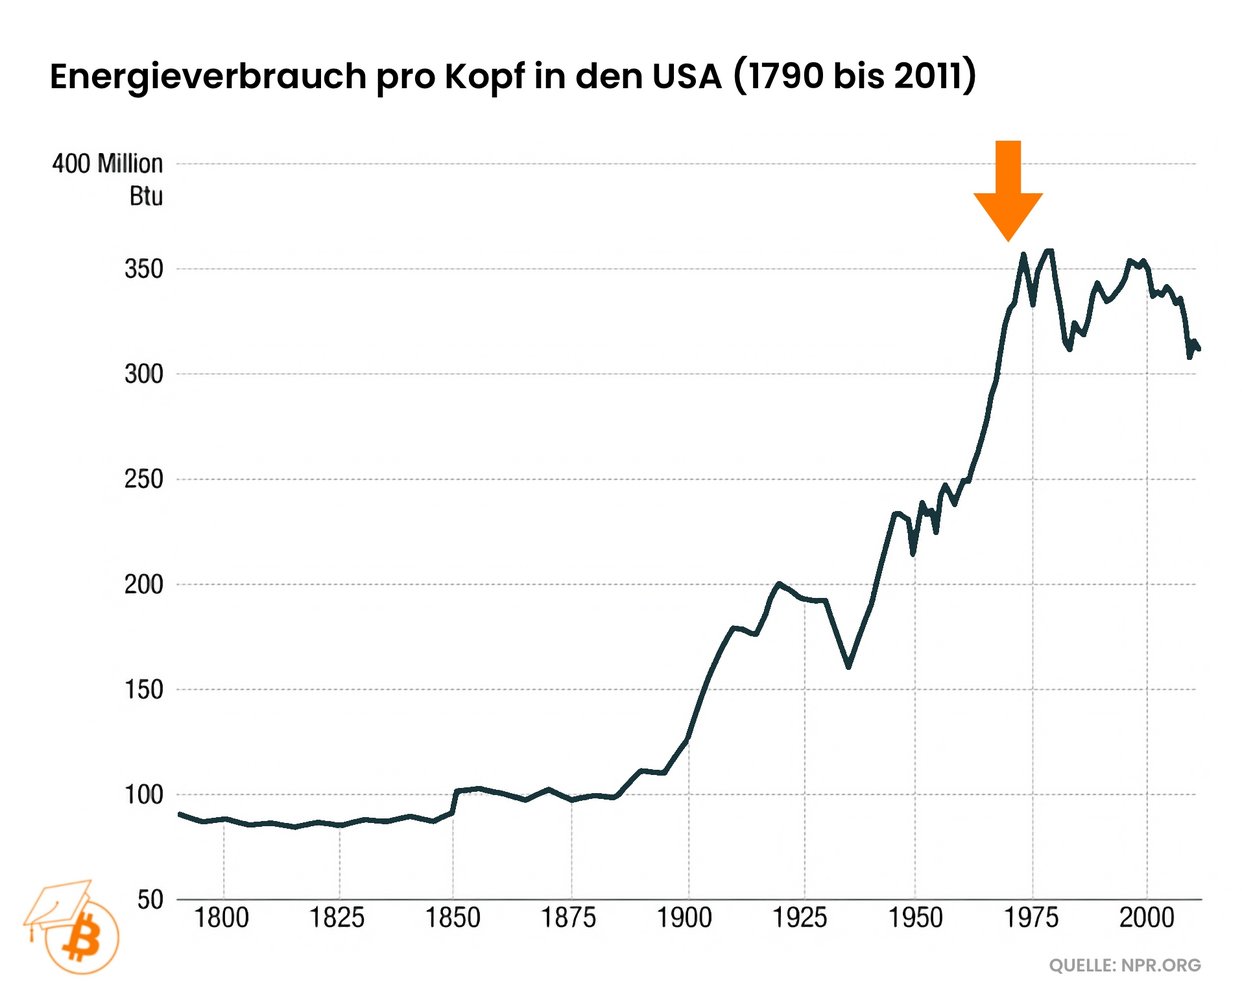
It is interesting to note that per capita energy consumption in the USA has also been falling since 1971. In view of the climate change issue, it must be made clear that energy use is not a bad thing per se. In fact, it is essential for a country's prosperity to use a lot of energy:No high-income country is a low-energy country.
The approach of astrophysicist Nikolai Kardashov is to determine a kind of civilization index based on energy consumption. Progress would therefore be desirable if mankind were to provide energy ever more efficiently without harming the environment.
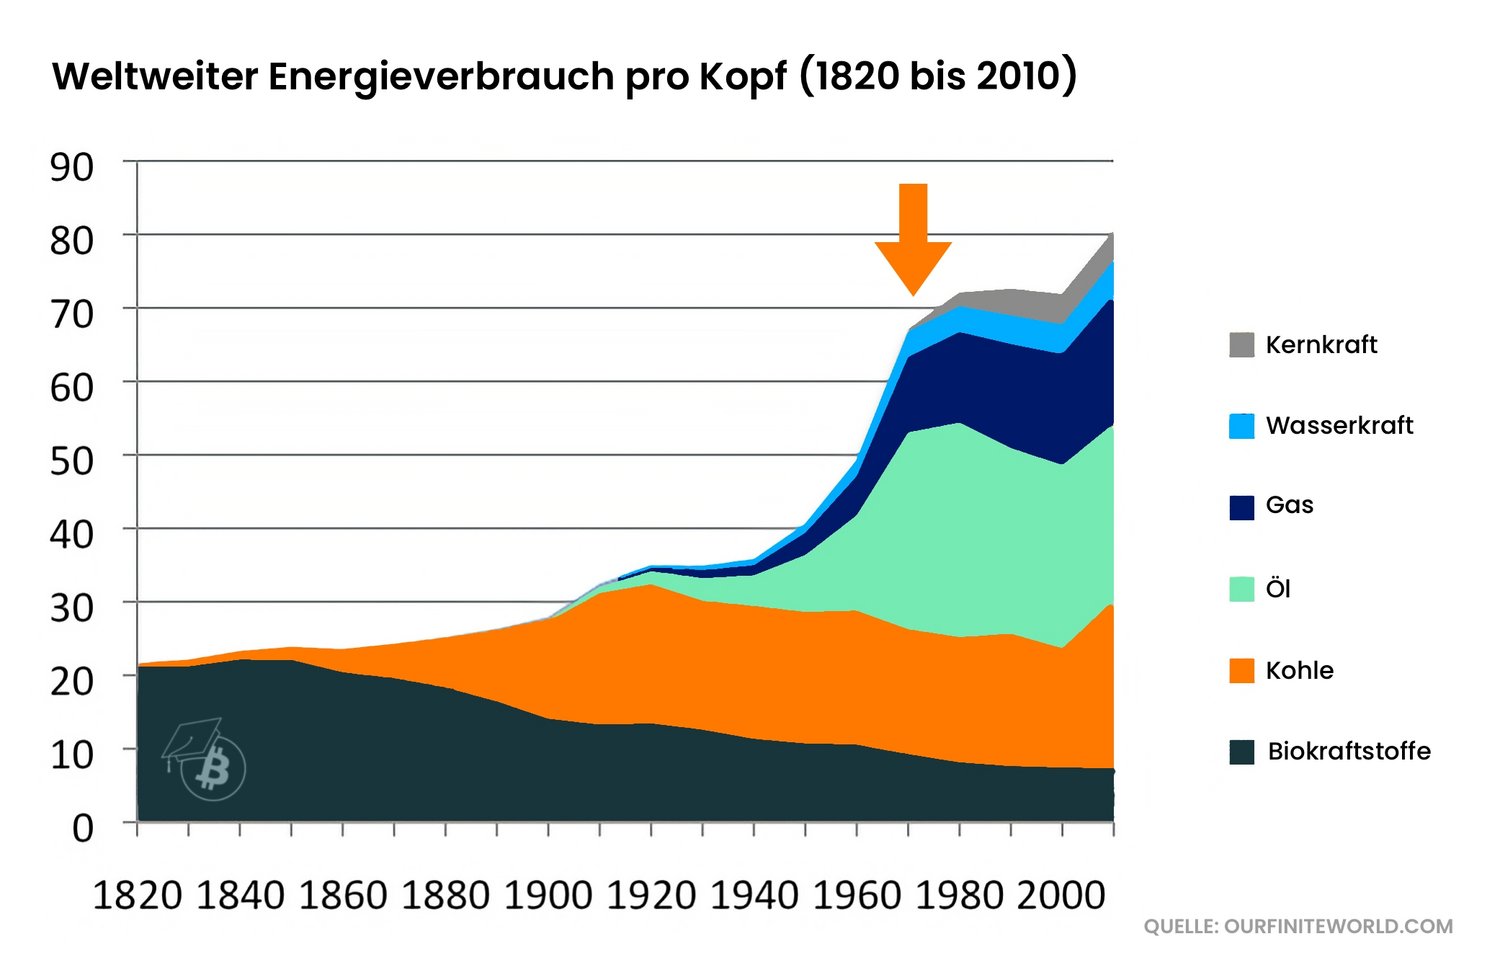
From a global perspective, there was also a decades-long stagnation in per capita energy consumption immediately after the end of the gold standard.
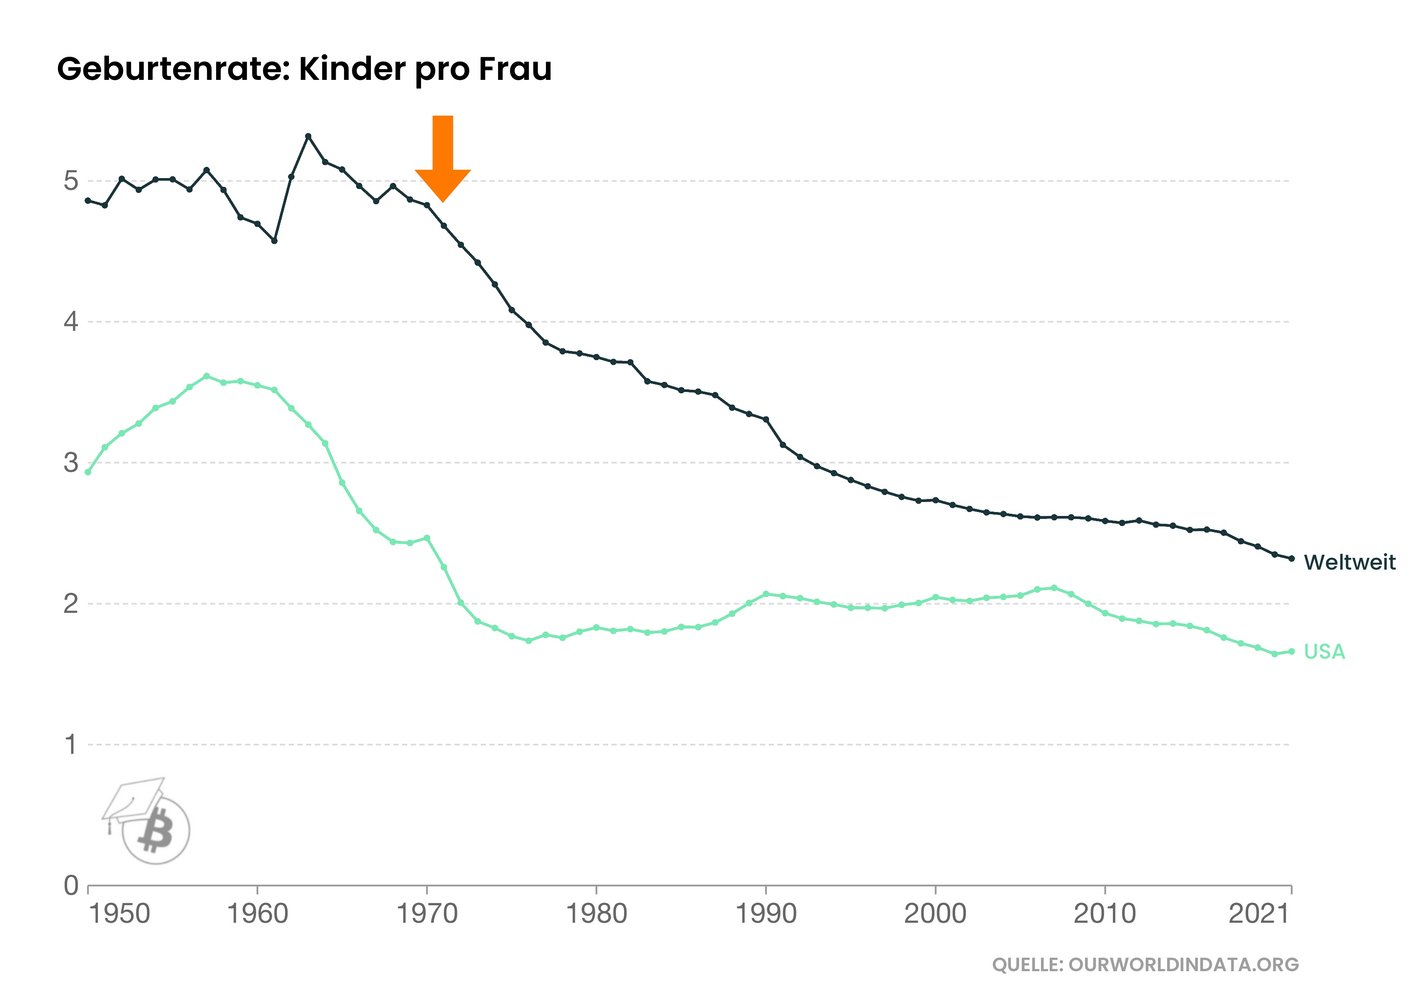
At this point, one could also argue that there was an increasing lack of prosperity to bring children into the world in the first place.
In the USA, the number of children per woman has temporarily fallen faster since the end of the gold standard. Worldwide, the current downward trend in the birth rate only really began around 1971.
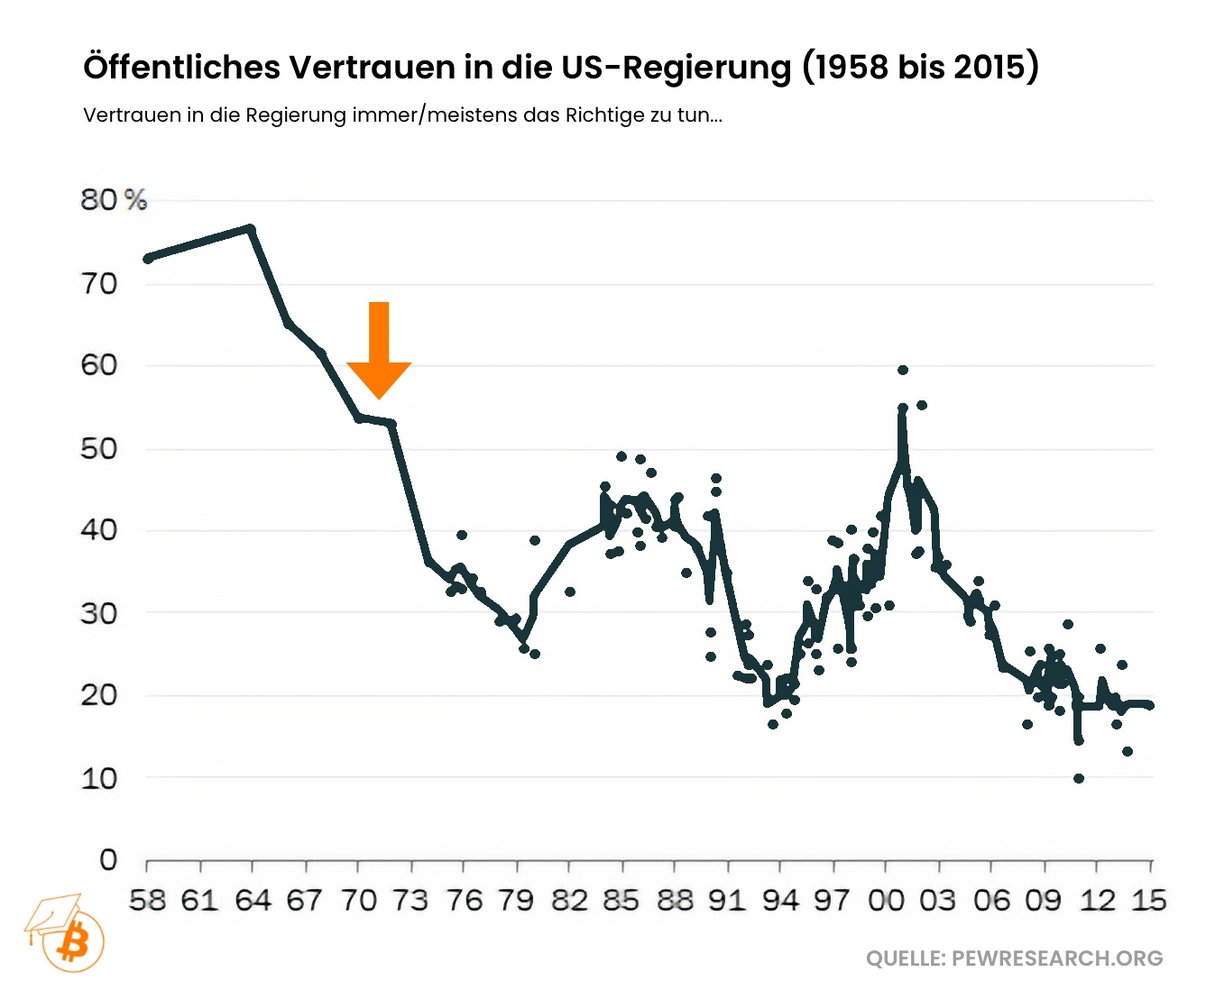
In view of the many negative developments, it is hardly surprising that fewer and fewer Americans say they trust the US government to do the right thing.
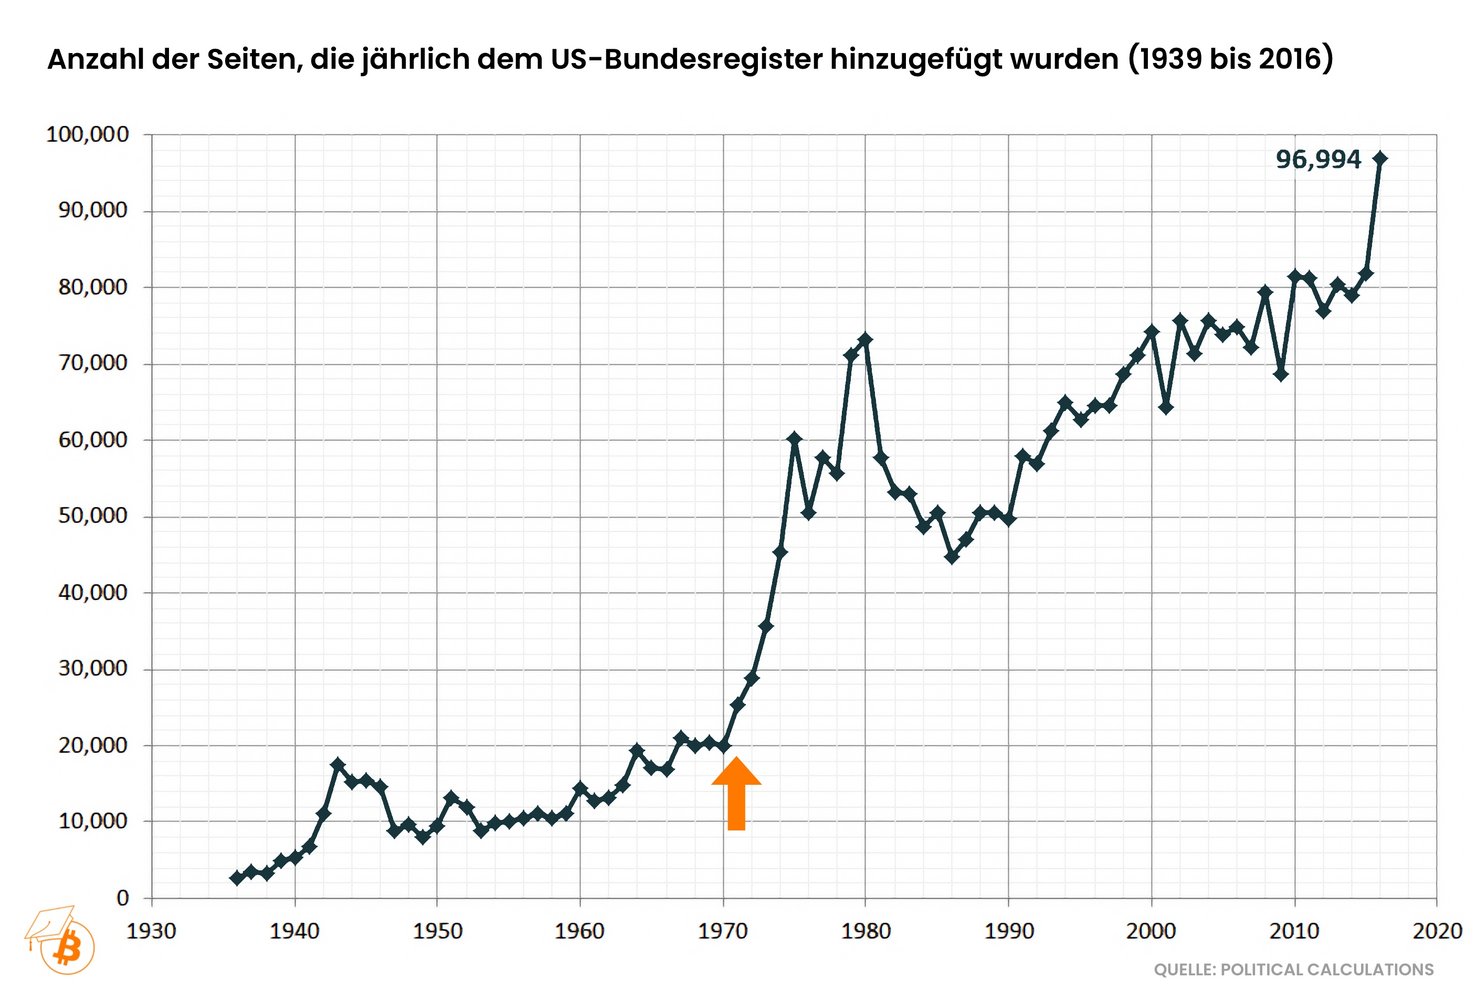
However, it does not seem to be due to a lack of laws, regulations and rules that US citizens have increasingly lost confidence in the state.
Since 1971, the number of pages in the US Federal Register has increased significantly. The number of pages in the US Federal Register is generally regarded as a proxy for economic regulations.
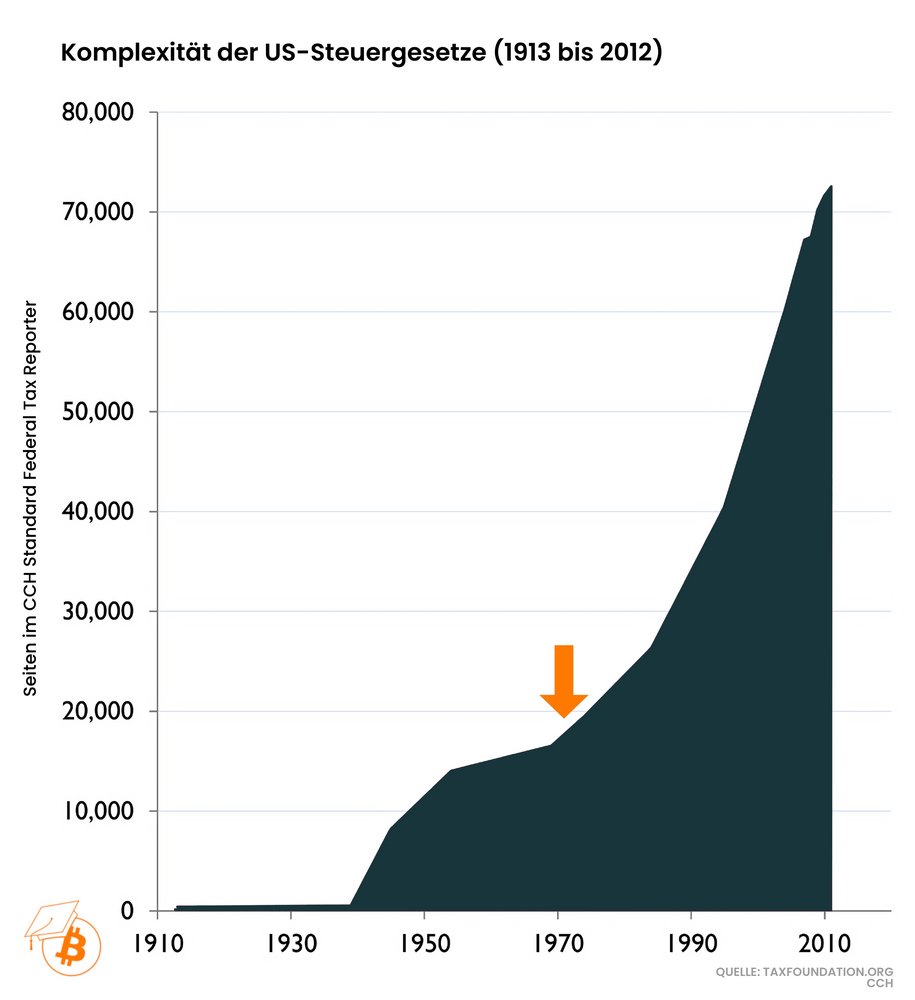
The number of pages in the tax code has also increased significantly since 1971. Today, there are far more than four times as many pages as immediately before the end of the gold standard.
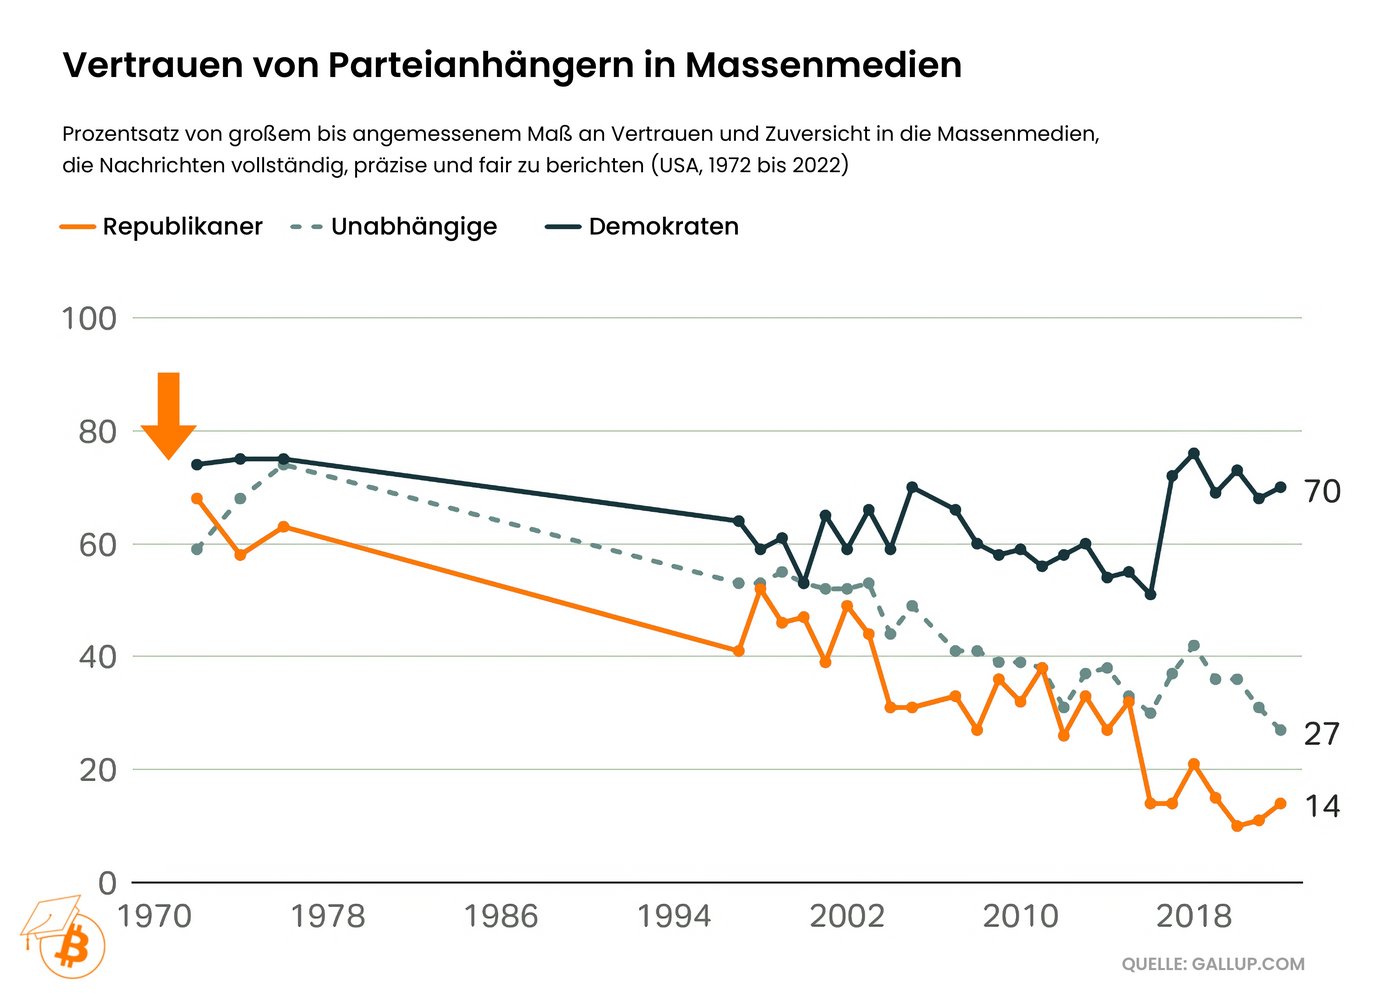
General trust in the mass media has also fallen since the end of the gold standard - especially among Republicans. In the early 1970s, around 70% of Republicans believed that the mass media reported accurately and fairly - this figure is now well below 20%.
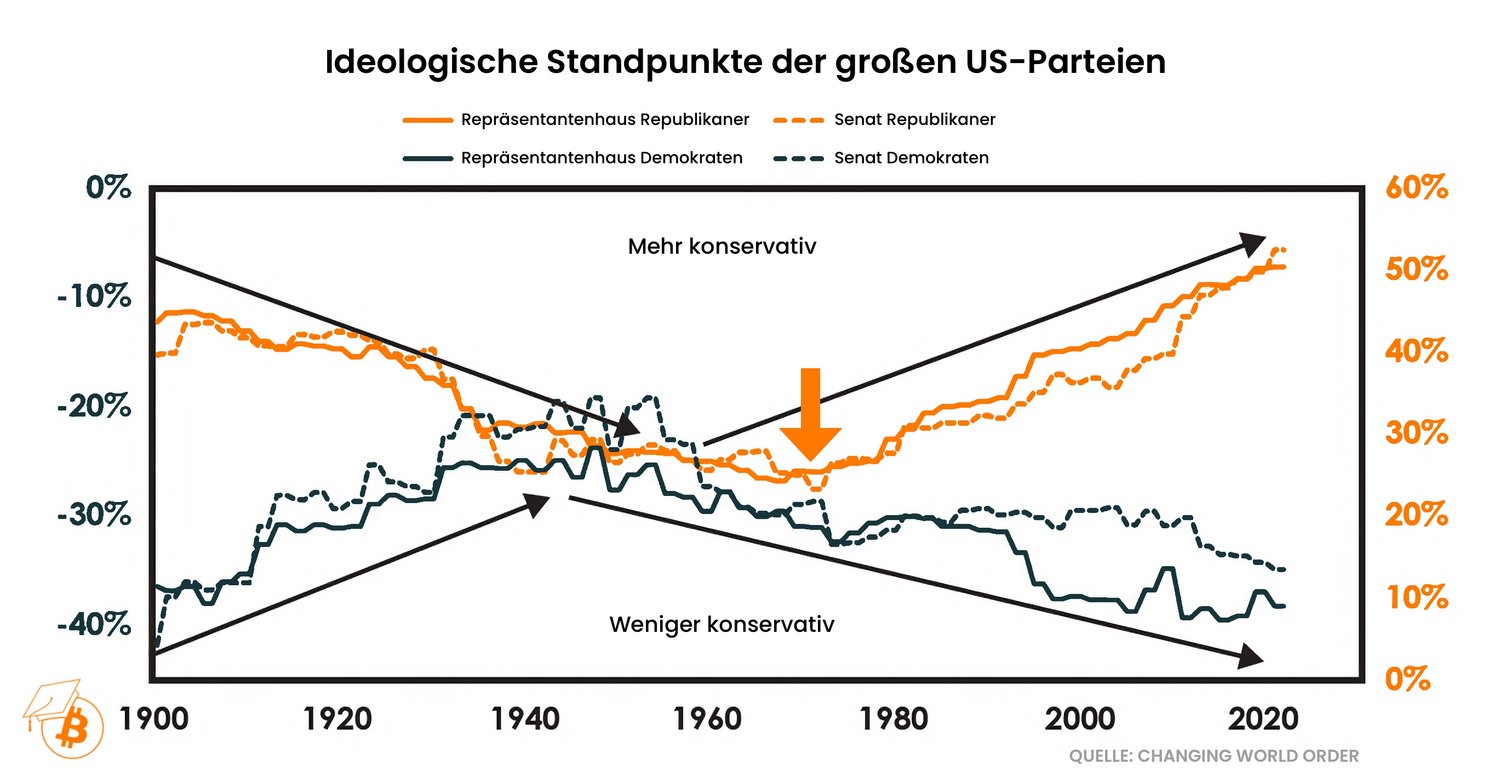
A lot has also changed politically since 1971: In the Senate and House of Representatives, the ideological positions of the Republicans have since become significantly more conservative again, while those of the Democrats have become less and less conservative. This means that the two political camps have been drifting further and further apart ideologically since the end of the gold standard.
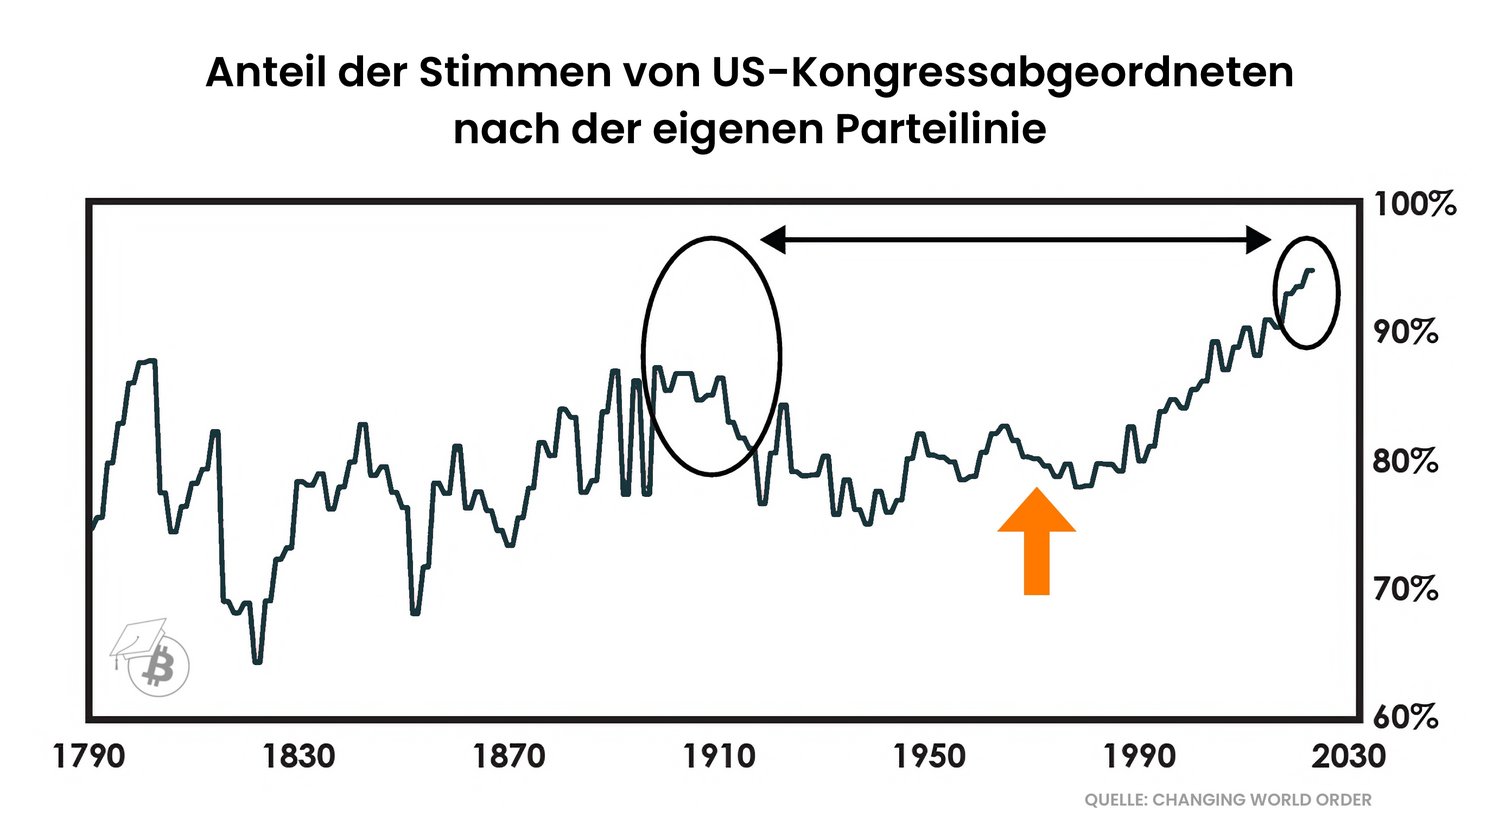
In addition, since the end of the gold standard, members of the US Congress are increasingly voting along party lines again. In other words, fewer compromises are being made.
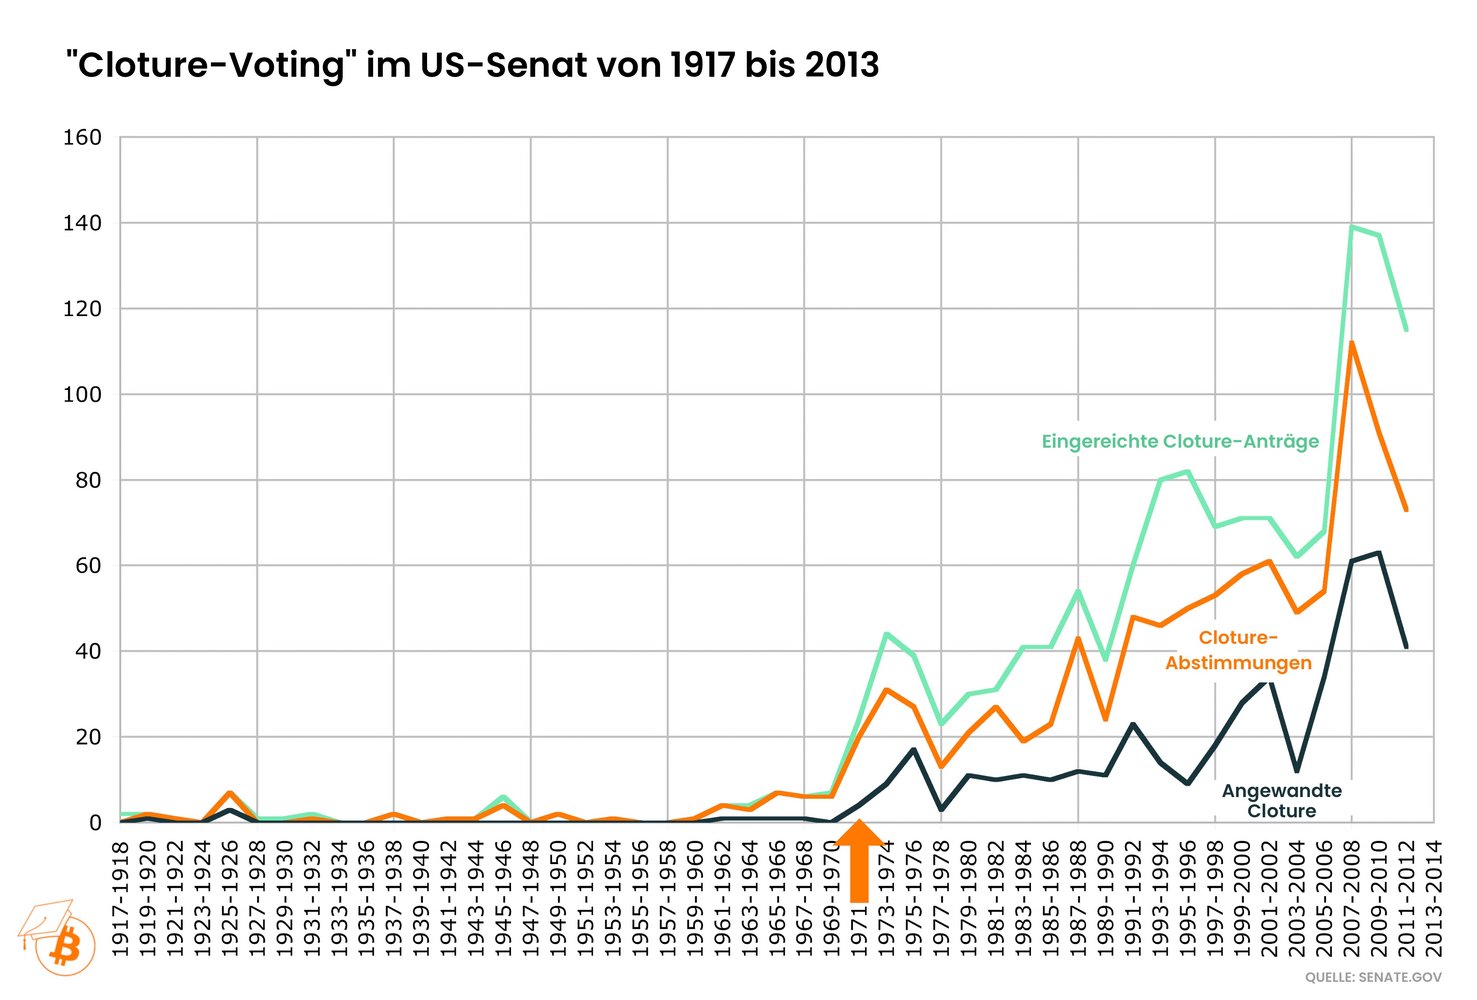
Since the end of the gold standard, we have also seen a drastic increase in cloture voting in the US Senate. This means that political debates have increasingly ended prematurely in order to move on to the vote. It is obvious that this increase can be attributed to the increasing political division and declining willingness to compromise since then.
Political division is usually a consequence of frustration in society as a whole due to the situation and a widening gap between rich and poor.
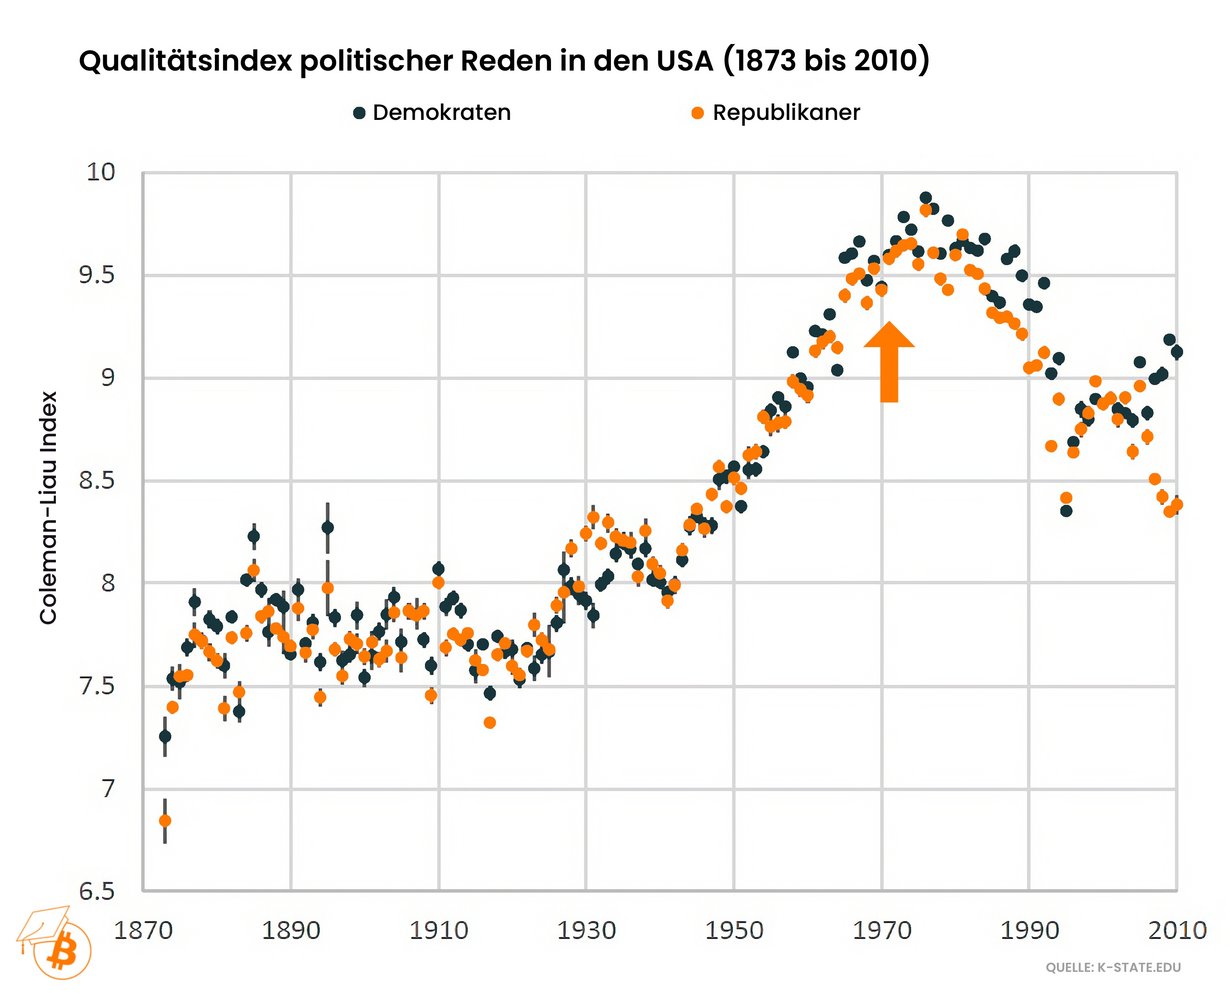
Interestingly, the quality of political speeches has also declined since the end of the gold standard - during the gold standard it rose significantly. Since then, political speeches have focused more on emotion and at the same time have made use of an increasingly lean vocabulary and simpler language.
Simplified messages are a feature of populism and populism tends to boom during periods of political division, which in turn is due to a widening gap between rich and poor.
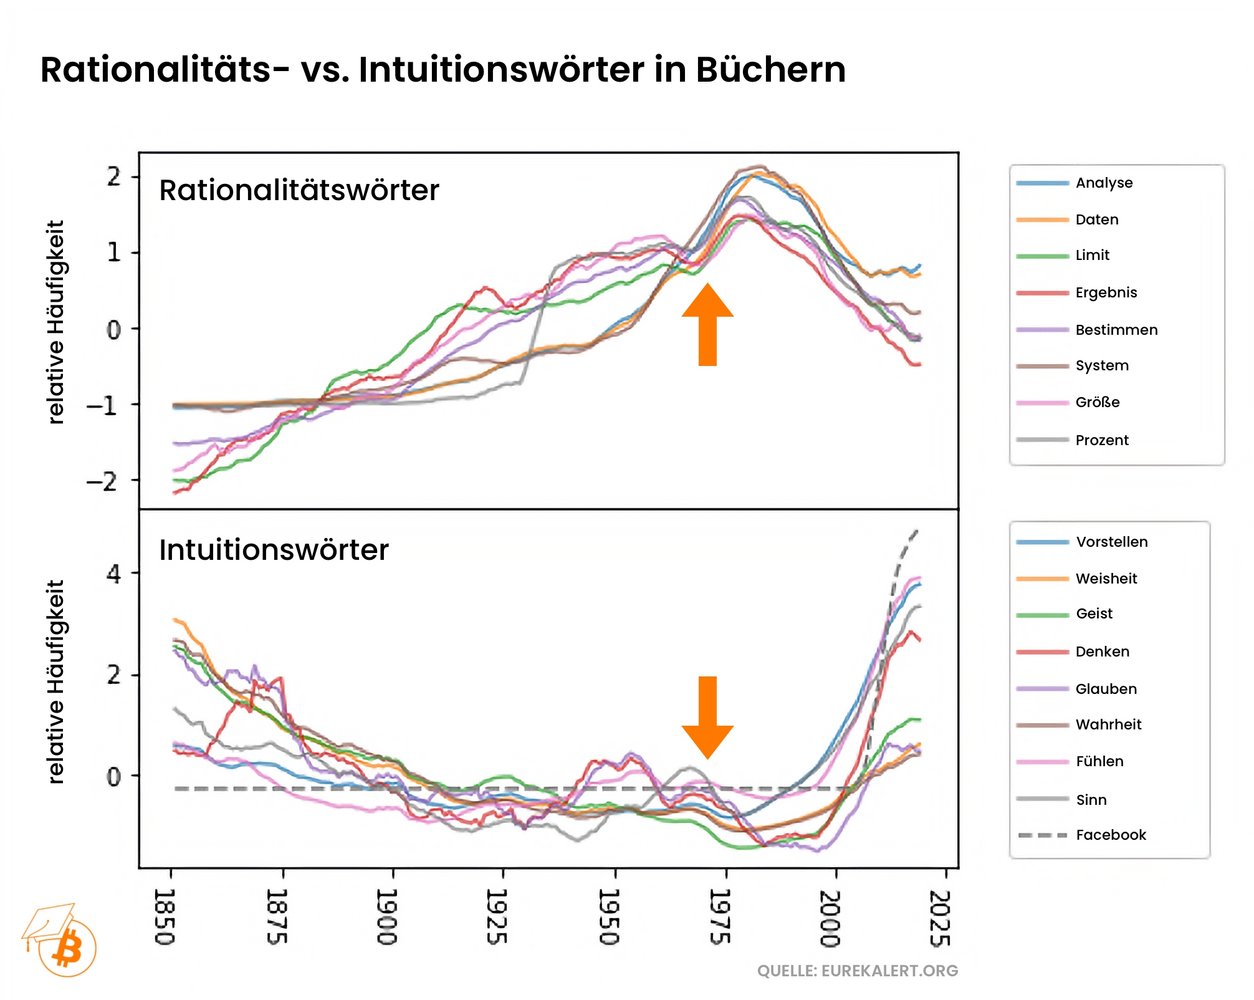
The shift in language also becomes apparent when you look at the relative frequency of certain words in books. Since the end of the gold standard, "rationality words" such as analysis and data have been used less and less frequently, but "intuition words" such as imagine and mind are increasingly being used instead.
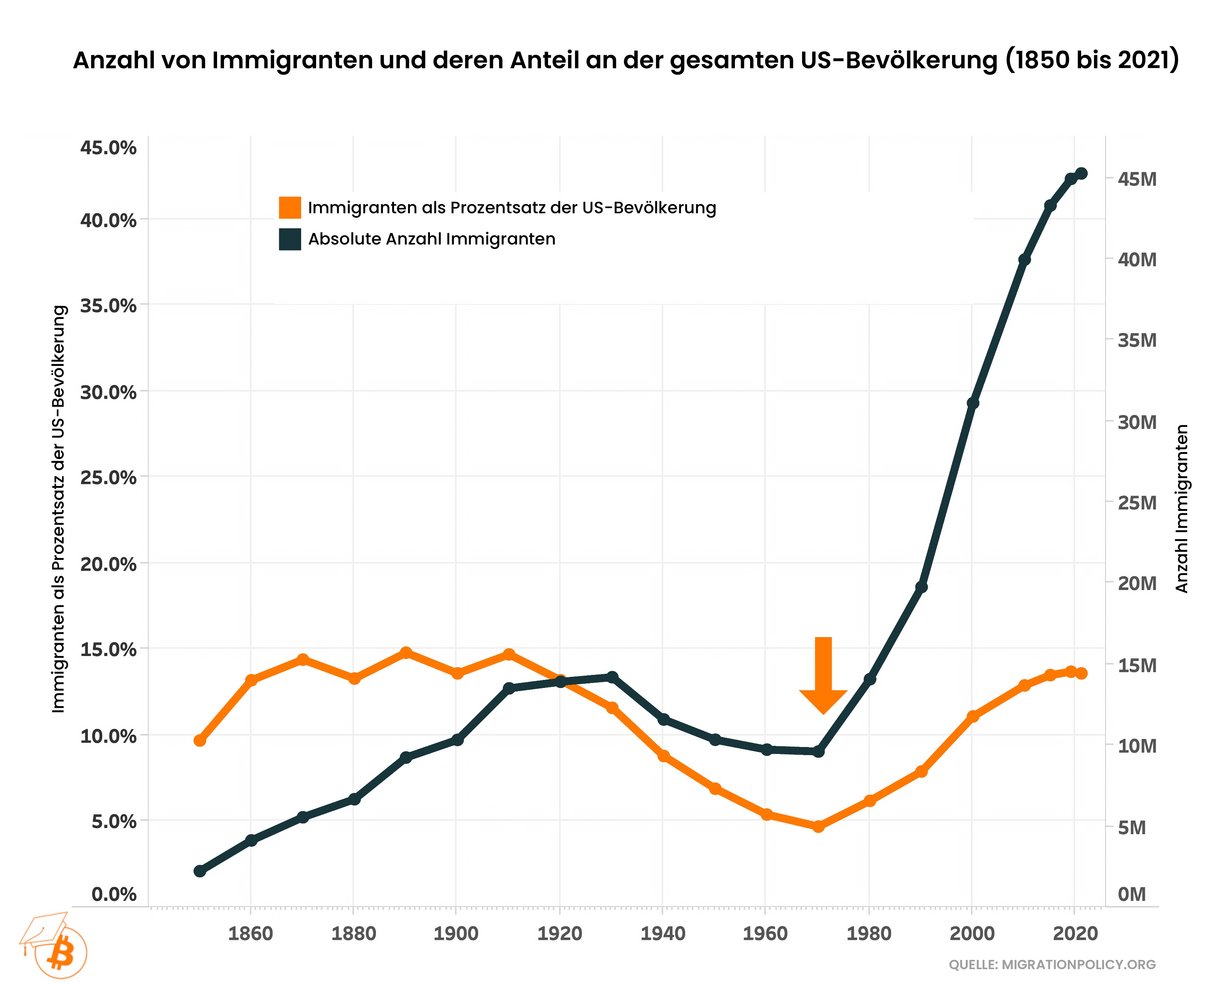
The number of migrants in the USA has also exploded since 1971
The exploding number of migrants in the USA since 1971 can be attributed to the labor shortage.
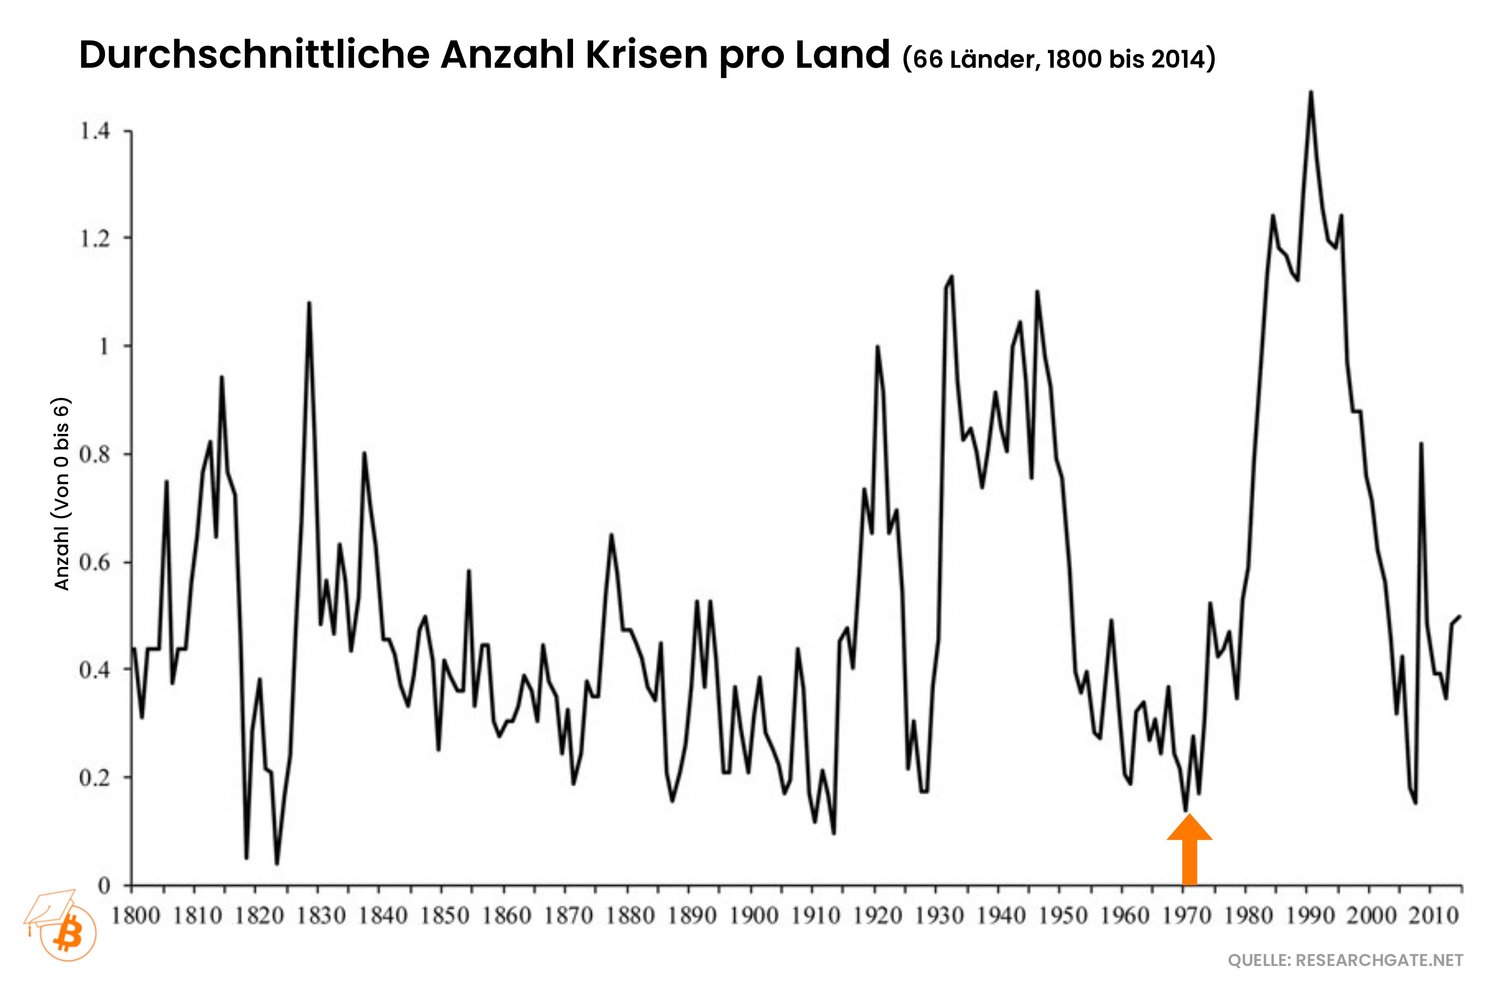
Another explanation for the increased immigration to the USA is the crises in other countries. The number of global crises exploded immediately after 1971 - in the decades before, when the gold standard prevailed, there were relatively few crises.
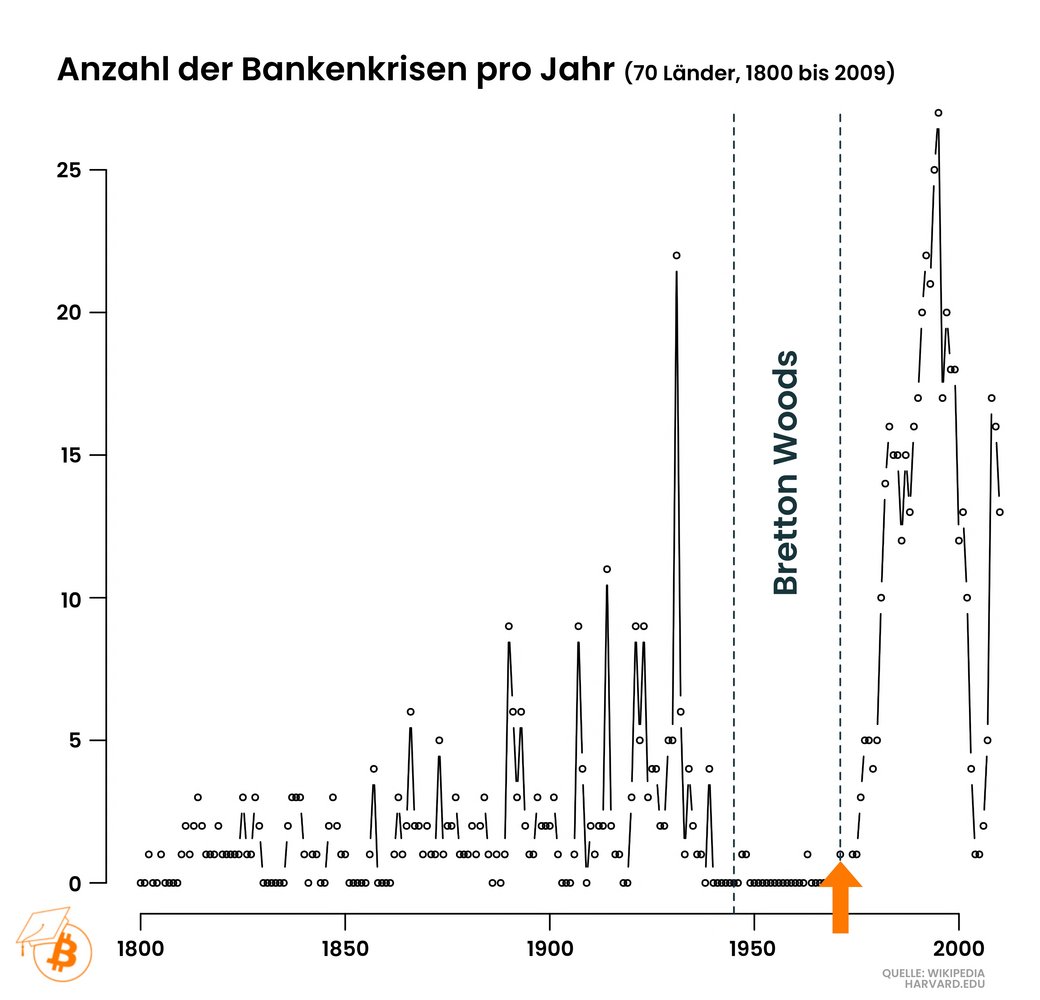
An almost identical picture emerges when we look at the number of countries with banking crises. Banking crises increased significantly worldwide with the end of the gold standard. During the gold standard, banking crises were virtually non-existent worldwide.
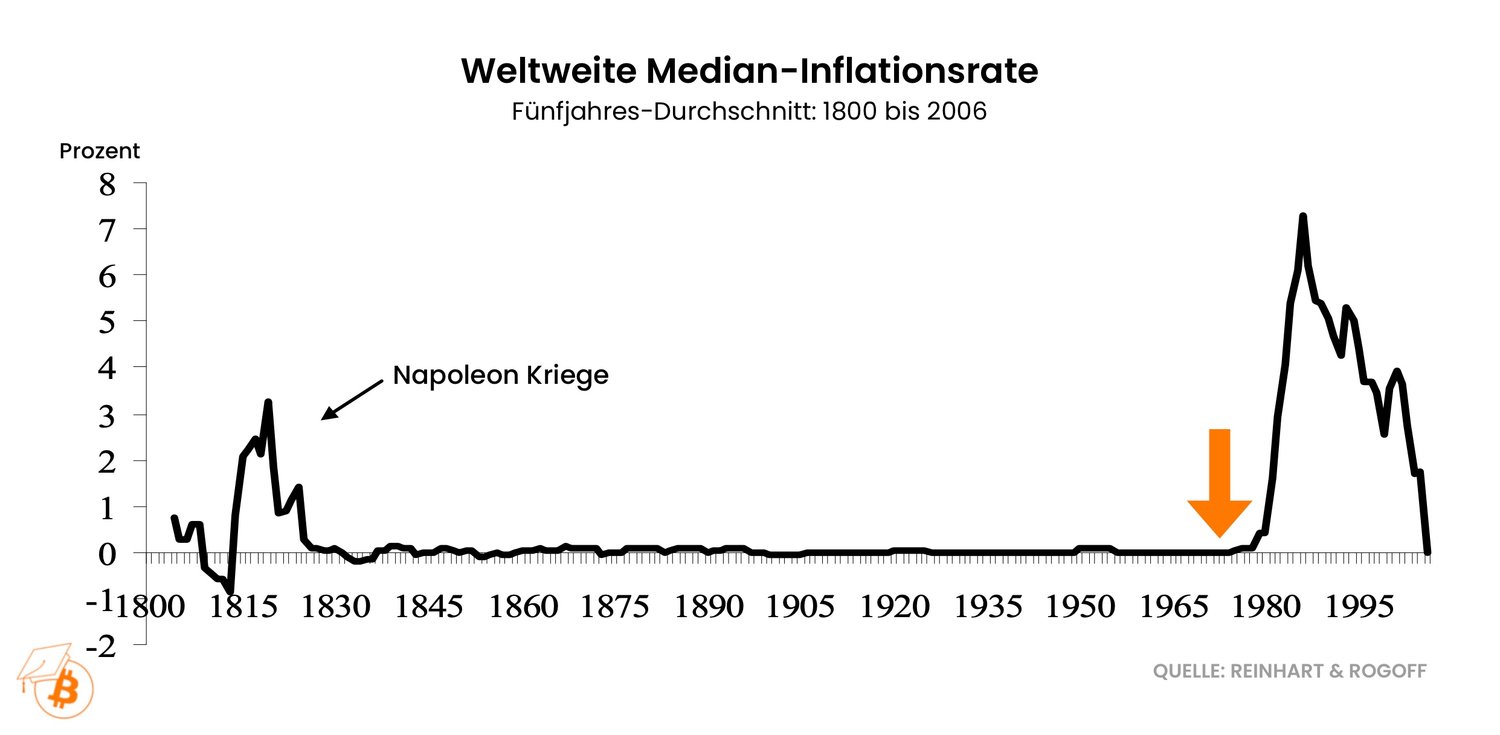
The origin of the crises seems to lie in rampant inflation worldwide. The global median inflation rate literally exploded after the end of the gold standard. This means that more and more countries had to contend with high inflation rates.
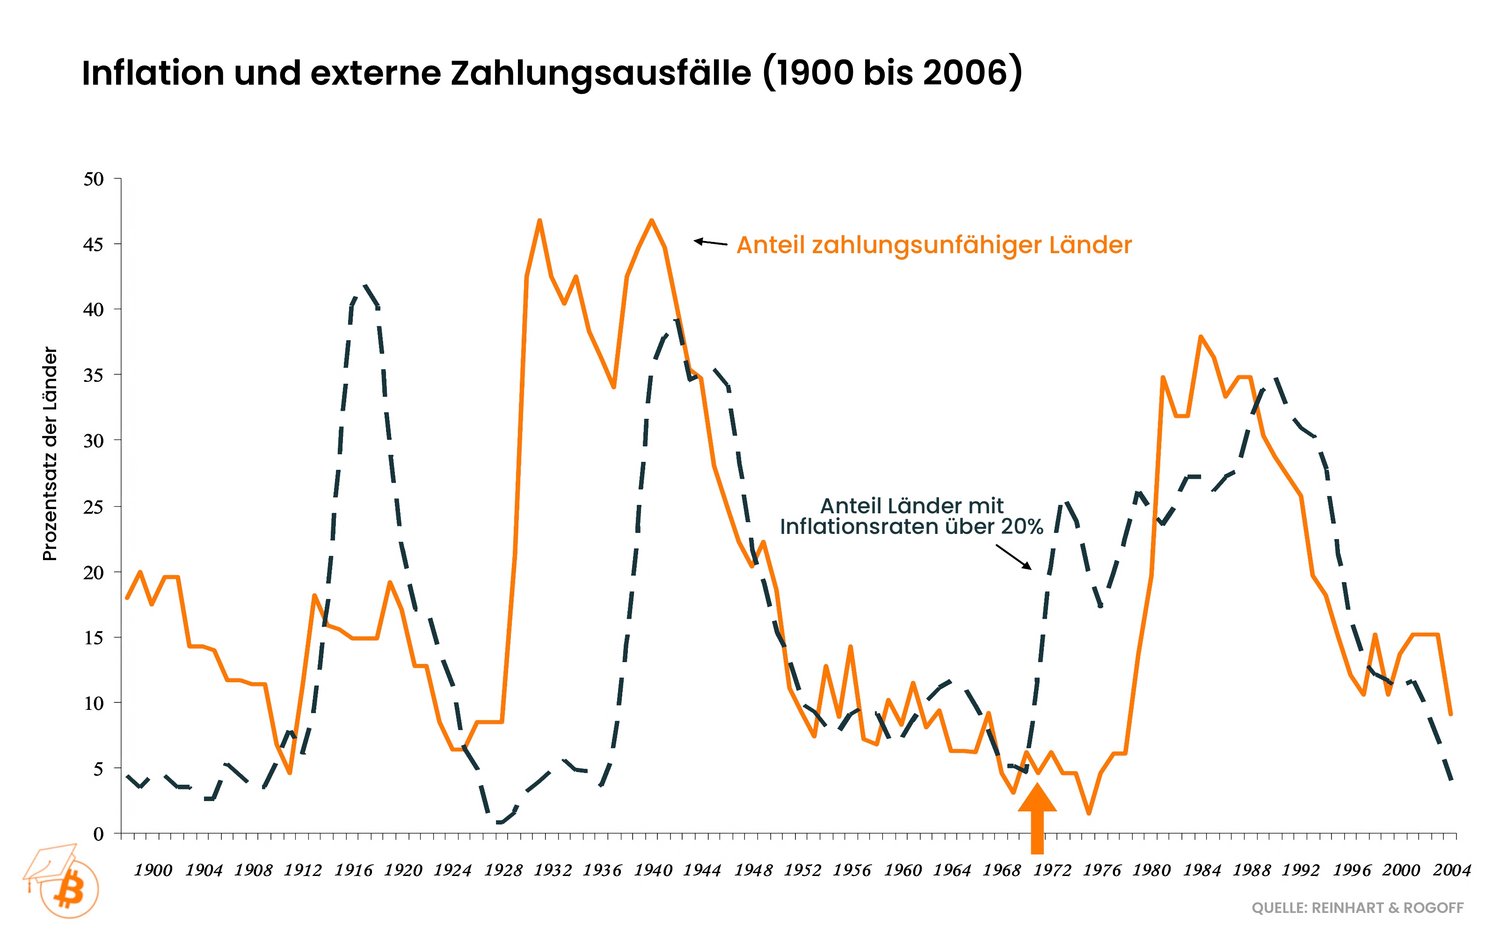
There were also hardly any sovereign defaults during the gold standard. Since 1971, there has also been a significant increase in sovereign defaults - even without world wars. The increase in sovereign defaults was a direct result of the fact that more and more countries were struggling with inflation rates north of 20%.
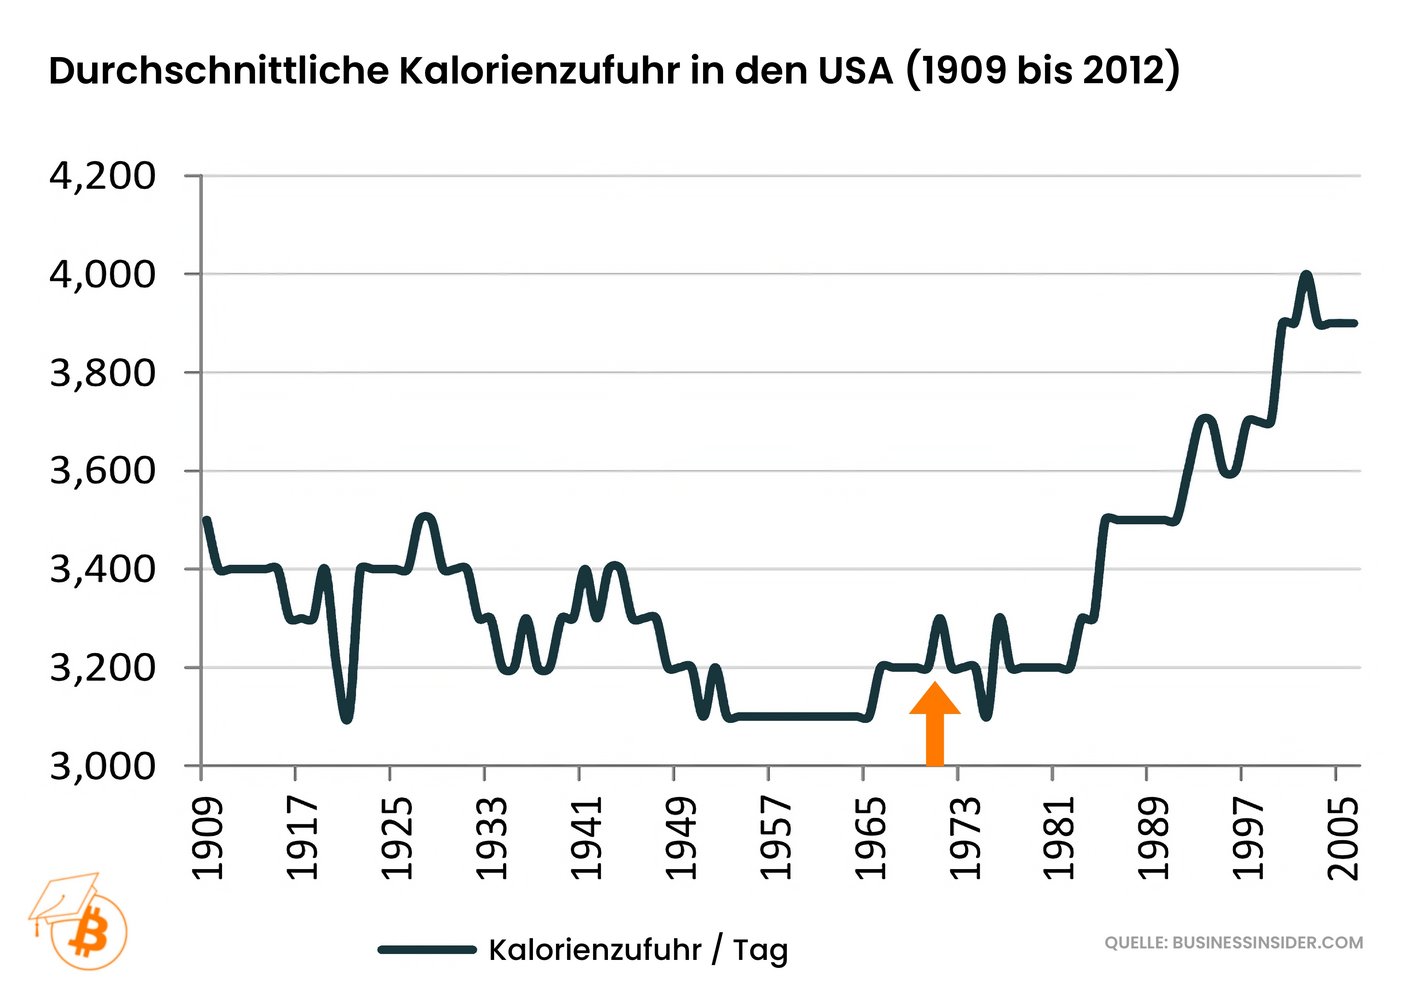
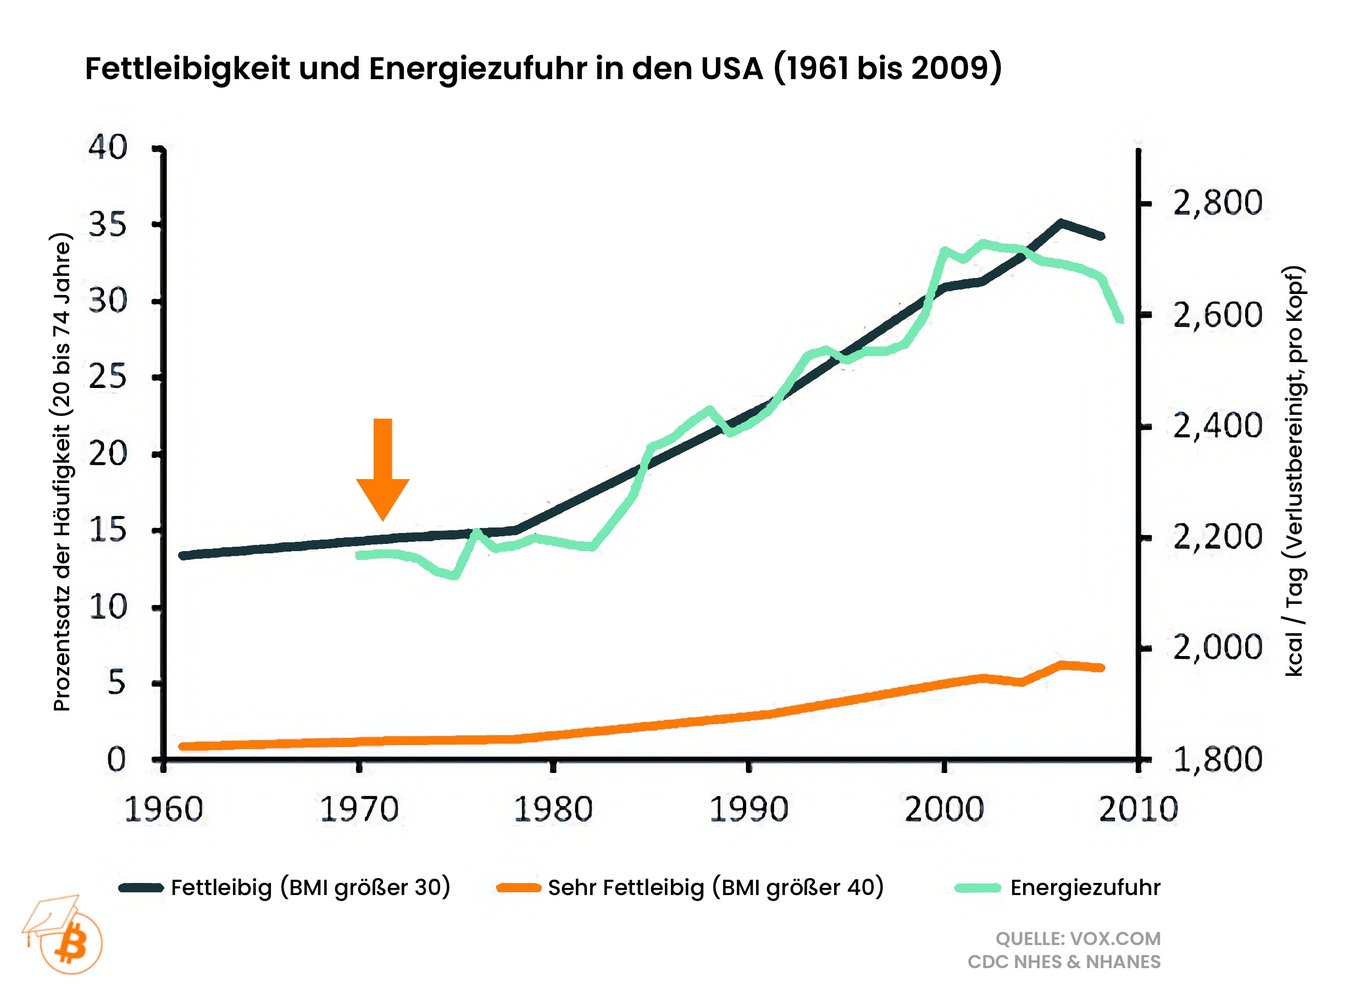
Since 1971, as already shown, consumerism in the US has gathered pace. This also applies to the consumption of calories. After the average calorie intake of Americans had been roughly constant to slightly falling for decades, it rose significantly after the abolition of the gold standard.
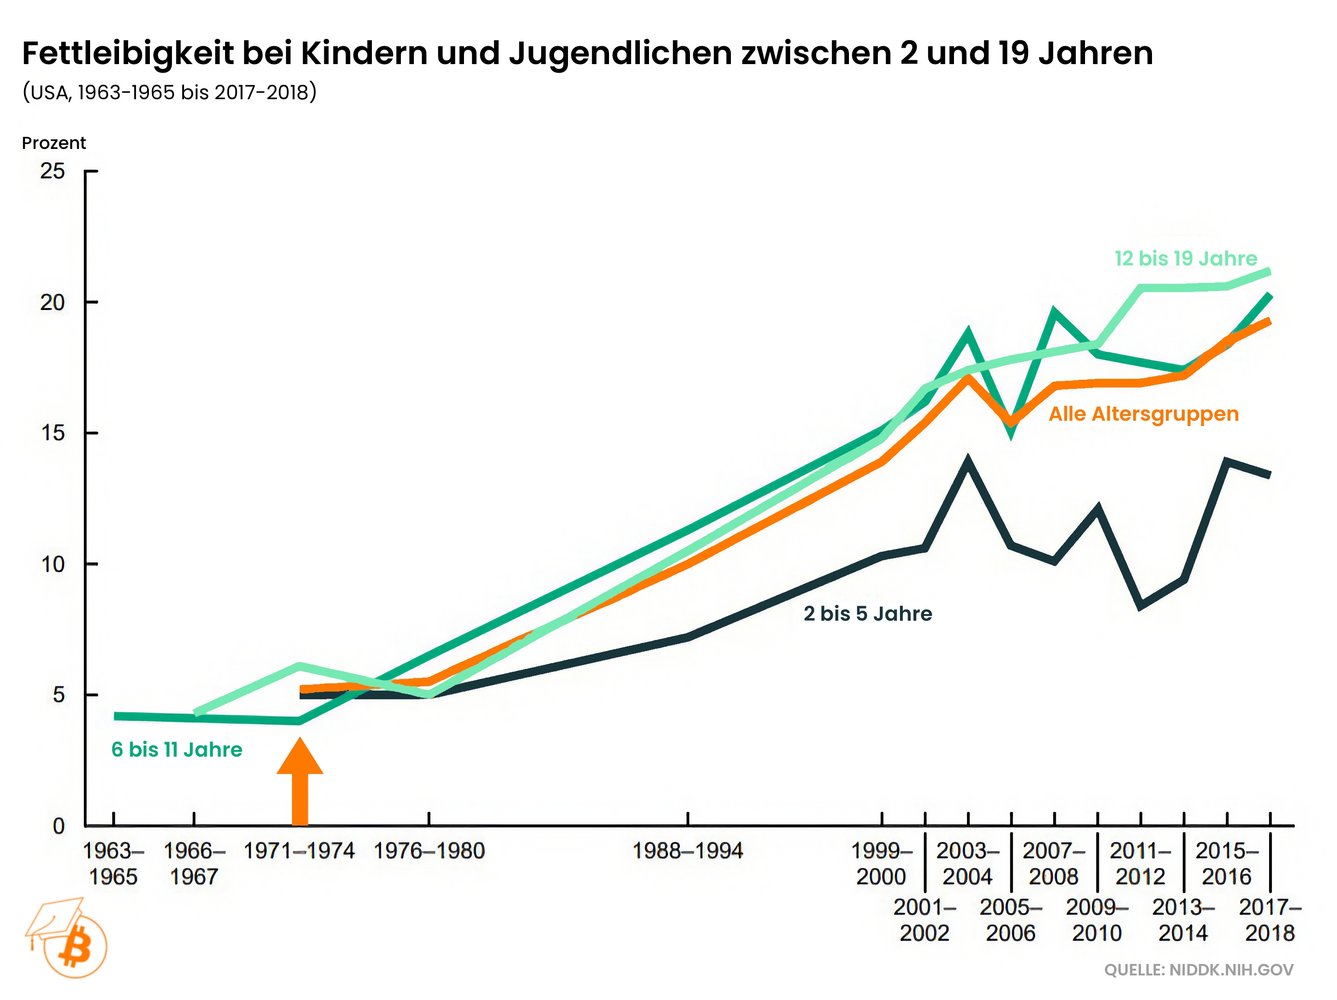
Since then, the obesity rate among US children has almost quadrupled - the proportion of overweight 2-19 year olds in 1971 was still around 5% - today it is just under 20%.
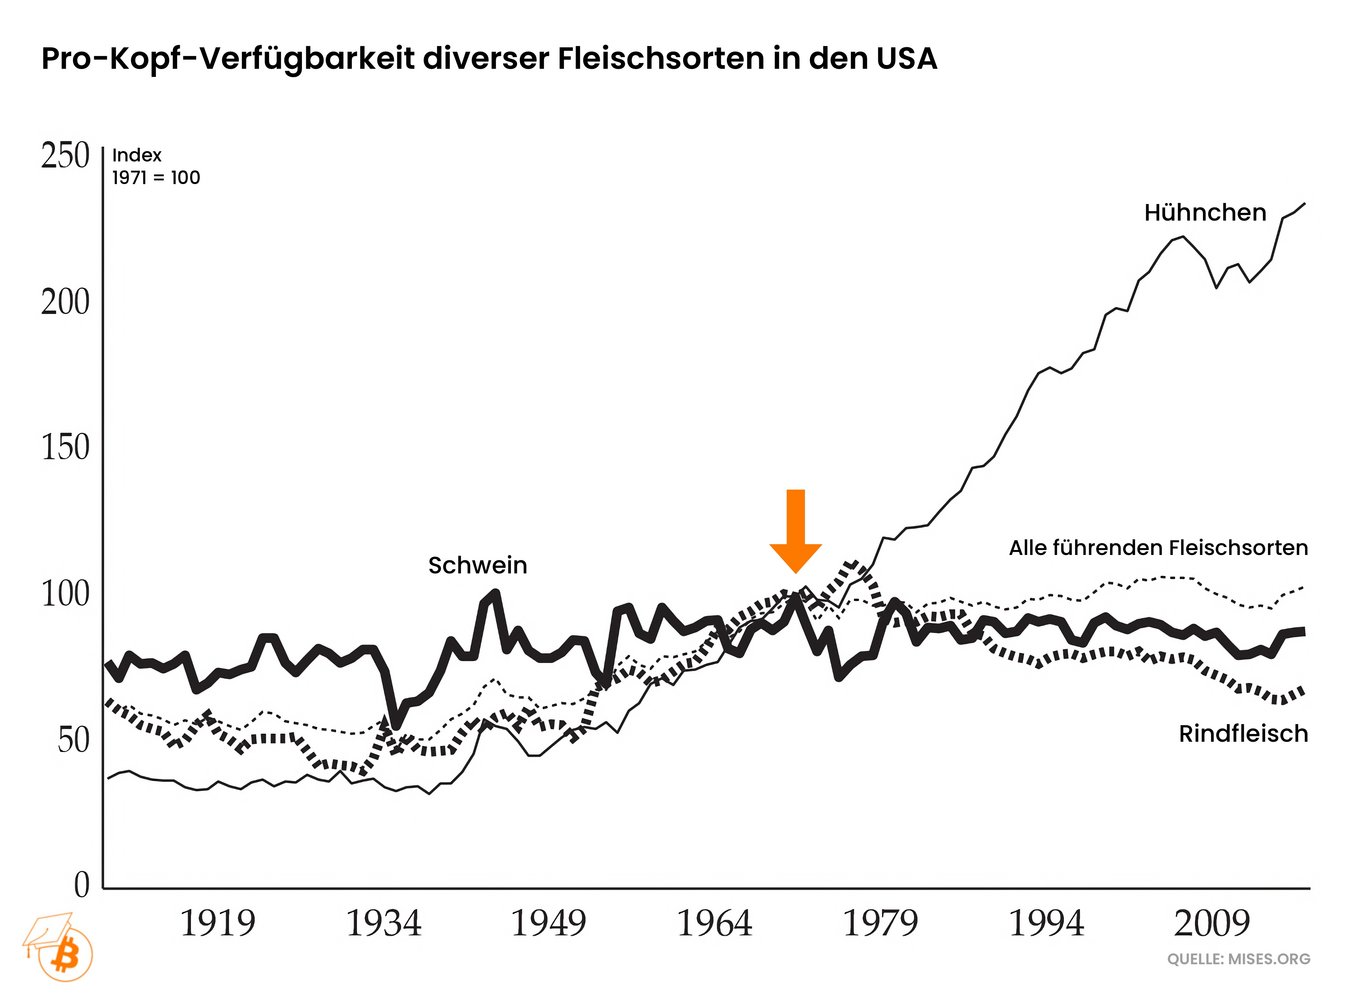
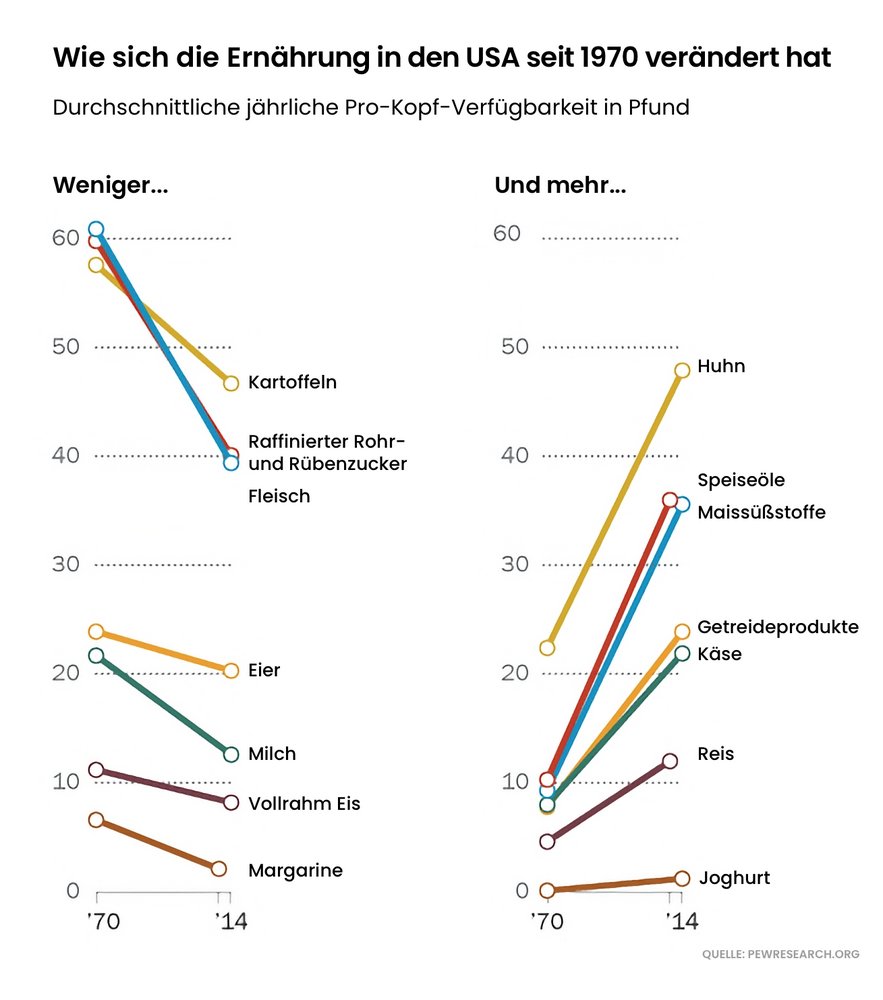
The switch to cheaper alternatives is particularly evident in the case of meat. Since 1971, the supply of relatively cheap chicken has continued to rise, while that of beef has declined.
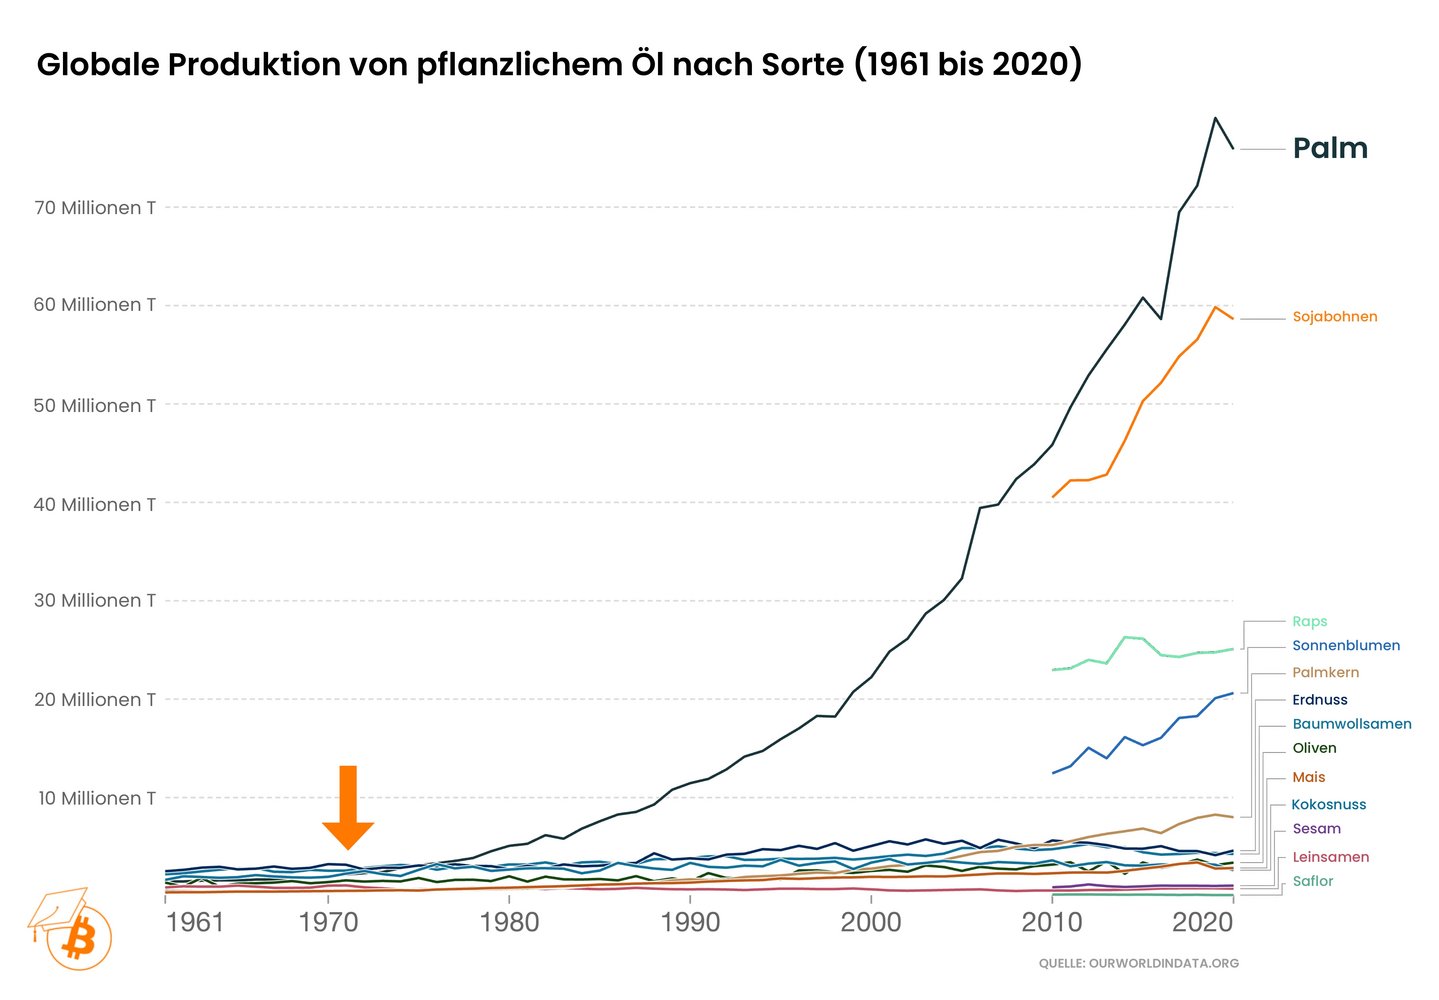
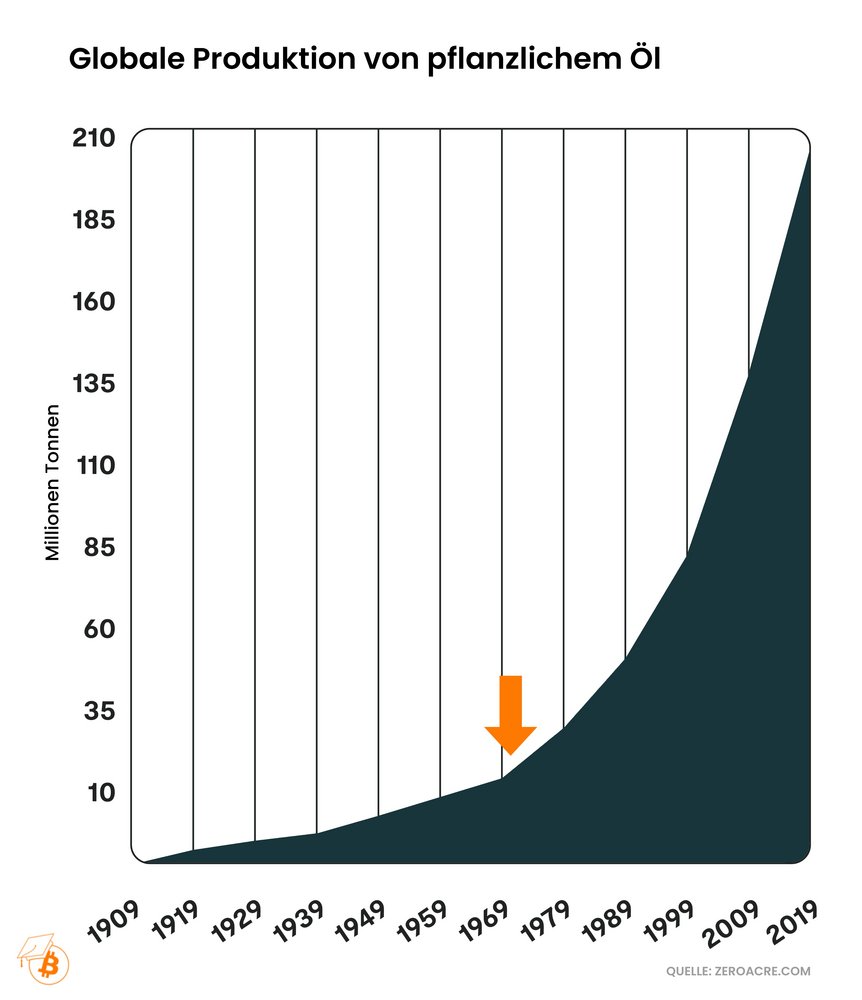
The largest share of vegetable oil production is accounted for by palm oil, which is environmentally harmful and unhealthy, but cheap. Global palm oil production has exploded since 1971.
Finally, there are a few developments in which the connection to the end of the gold standard can be explained by the fact that broken money has a generally negative social impact.
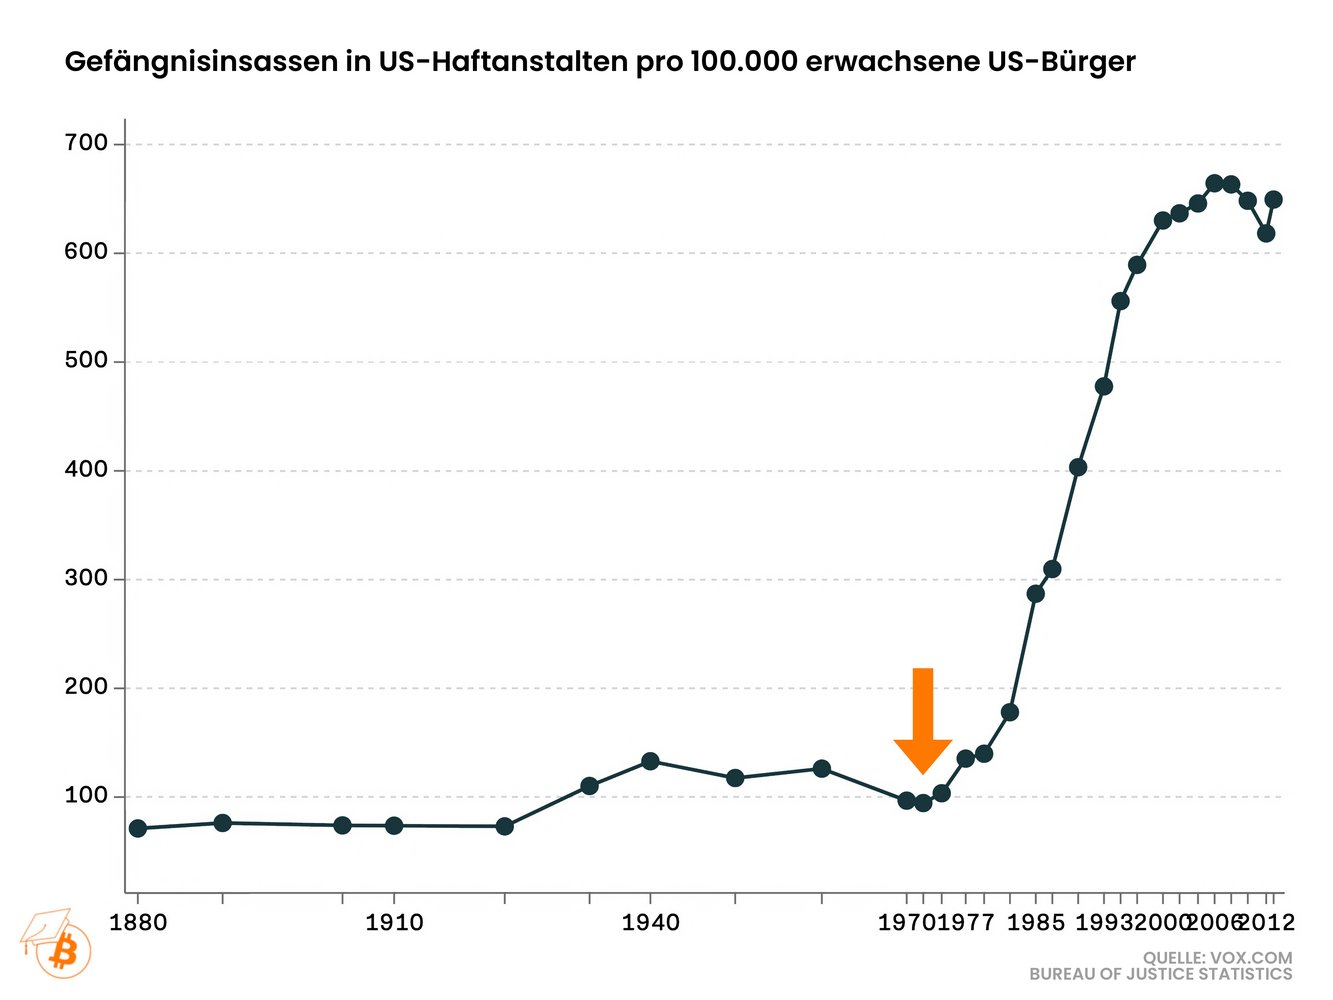
The number of prison inmates in the USA has exploded since 1971. The picture is just as clear when the number of prison inmates is put in relation to the total population. At the end of the gold standard, 100 out of every 100,000 US citizens were in prison - a few decades later, the proportion has increased more than sixfold.
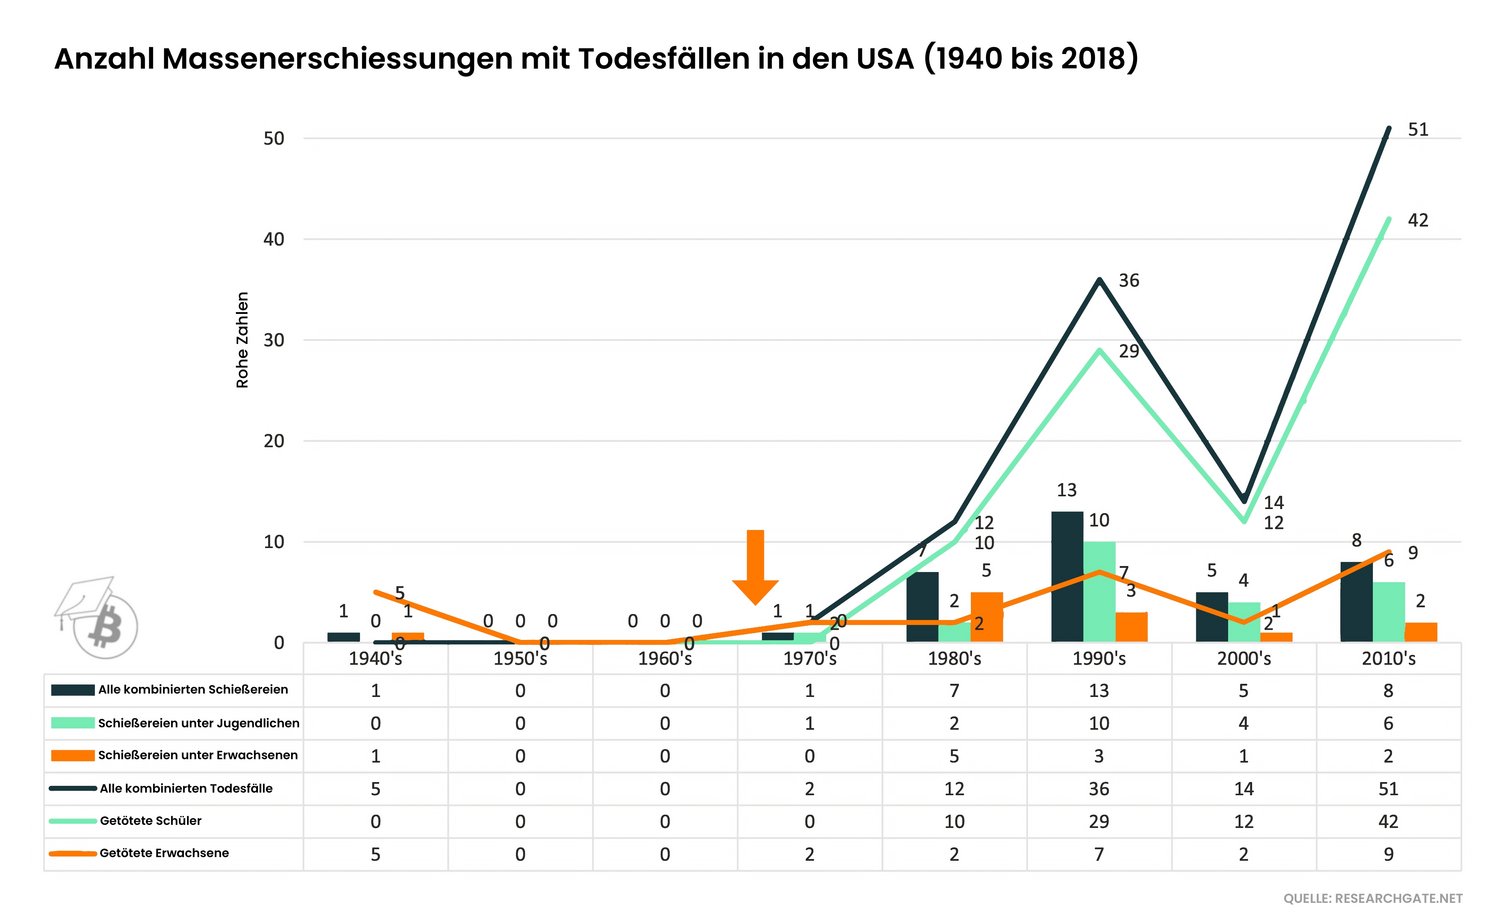
The number of mass shootings - especially among young Americans - and the number of deaths caused by them has also risen significantly since the end of the gold standard.
Due to the countless worrying developments since the end of the gold standard, it seems reasonable to conclude that the widespread use of hard money that cannot be centrally expanded will lead to a better world. For this reason, the slogan " fix the money, fix the world " has become established in the Bitcoin community.