You can usually buy cryptocurrencies in two different ways. Firstly, a broker can act as an intermediary. They buy cryptocurrencies for you in your name at a previously agreed price. Alternatively, you can also trade directly via a cryptocurrency exchange. Purchases and sales are listed in so-called "order books". In this Blocktrainer 1×1 article, we explain how these work and how to use them correctly.
You can think of an order book as an electronic directory. It lists all buy and sell orders in a sorted order.
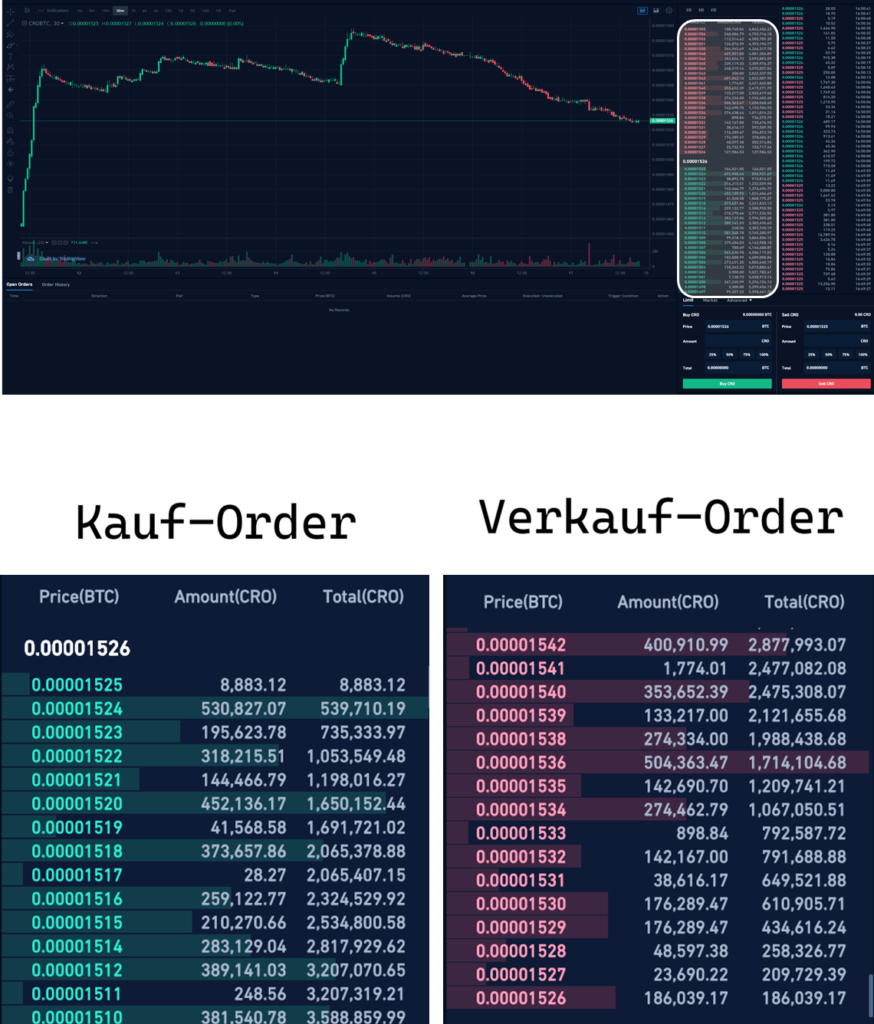
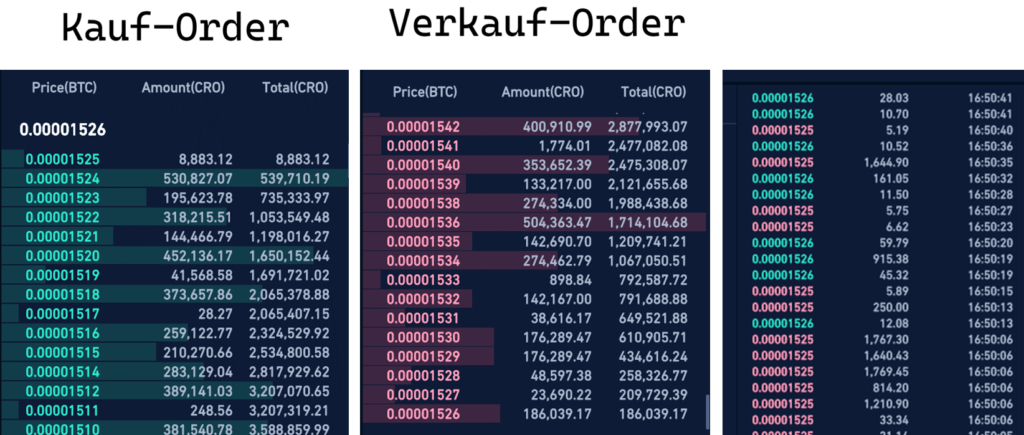
Usually, a cryptocurrency exchange (here Crypto.com) displays buy and sell orders separately, as shown in the following illustration.
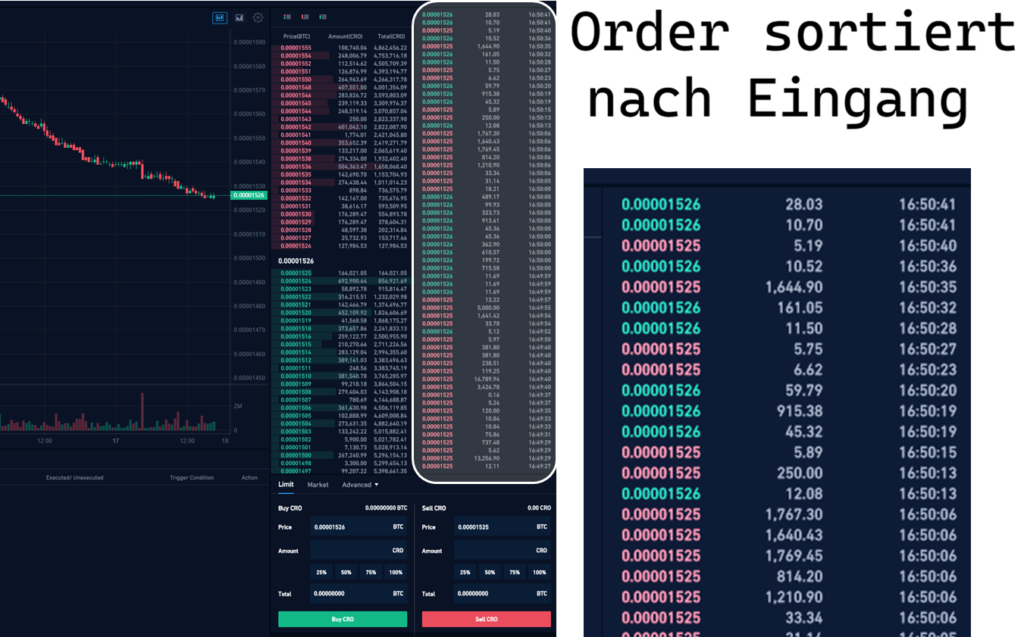
On the other hand, there is a mixed display of all orders, which are only listed by time of receipt.
The order book can provide information on the volume of buy and sell orders received in real time on the respective trading platform. These are so-called limit orders, which represent the price at which a buyer is prepared to buy a cryptocurrency and the price at which a seller is prepared to sell this cryptocurrency.
You may have heard the term market depth before. This is nothing other than the volume of limit orders in real time. The higher it is, the lower the market impact when a new large market order is placed. This also reduces market manipulation.
An order book is a very important tool, especially for traders. The trader can use supply and demand to check the current market situation. The order book is also the basis for charts and the technical chart analysis that builds on them. Let's take a look at a candlestick chart, as you can see in the following illustration.
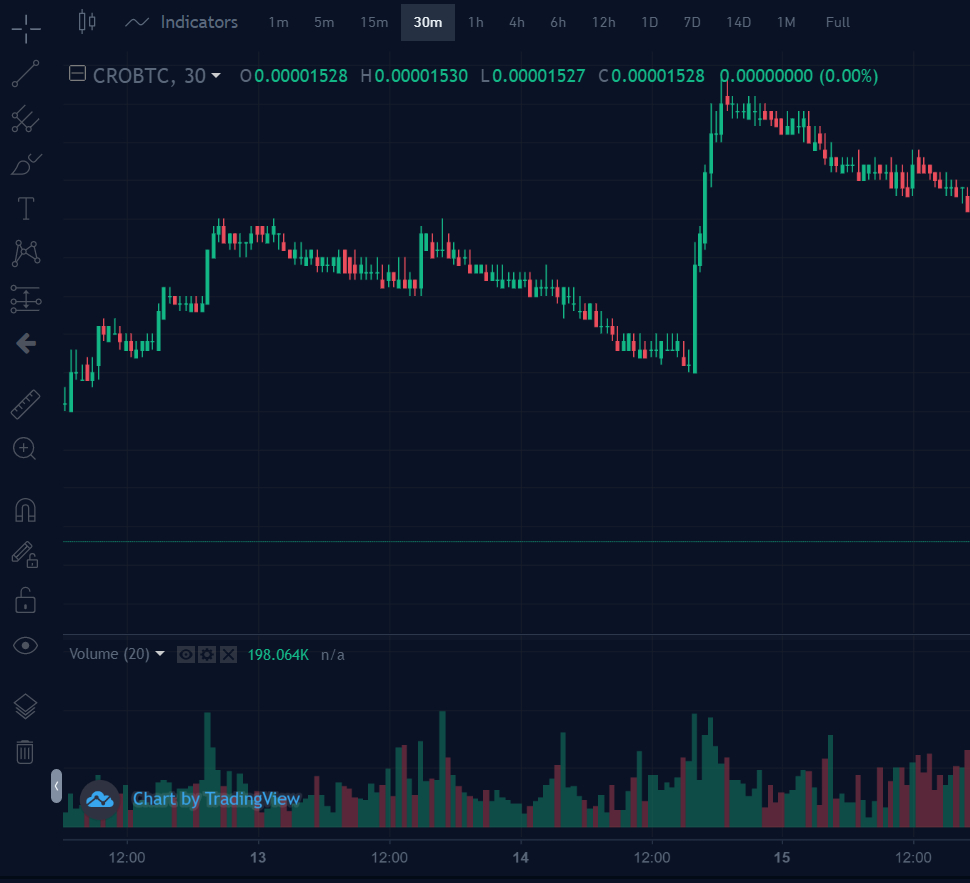
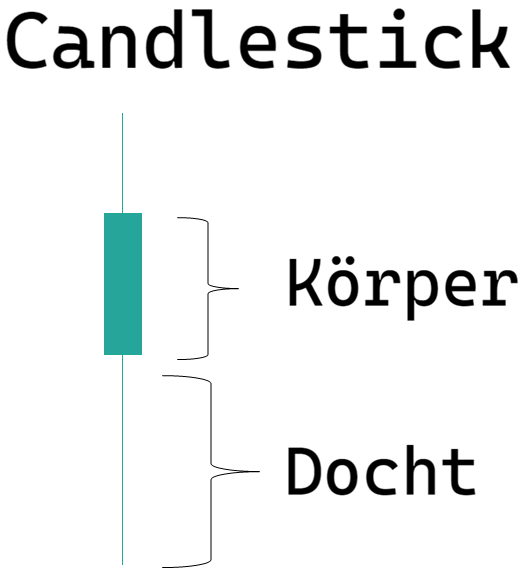
A candlestick shows the price development within a certain period of time. A green candlestick means that the price has risen during this period, while red indicates a falling price. The body of the candlestick shows the trader at which price the price movement began and when it ended, while the wicks of the candlesticks only represent the price range at which the price moved during the period.
Basically, such a chart is simply another representation of an order book, except that the candlestick chart only looks at the orders actually executed.
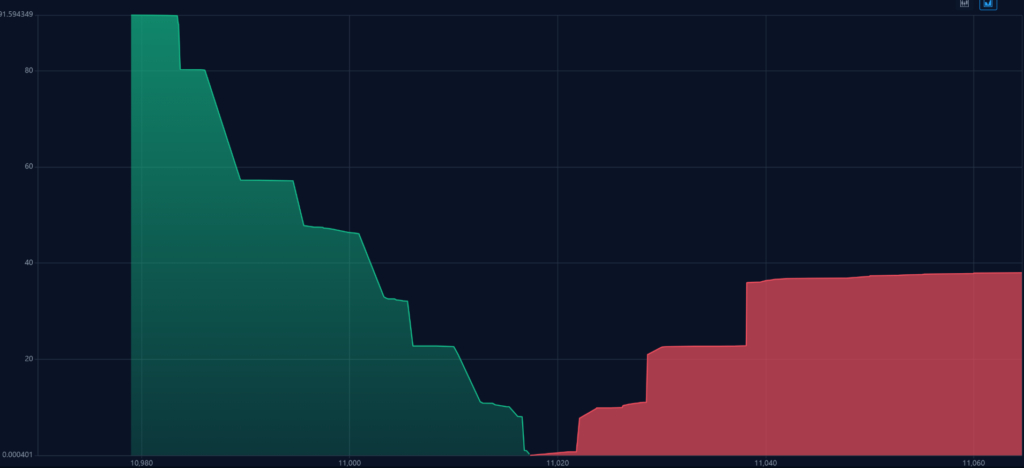
An order book can also be displayed as so-called buy and sell walls. Here is an example of the trading pair CRO/BTC on the Crypto.com platform. This display adds up the volumes of the individual orders at a certain price. The result is the following volume chart. In this case, buy and sell orders are balanced.
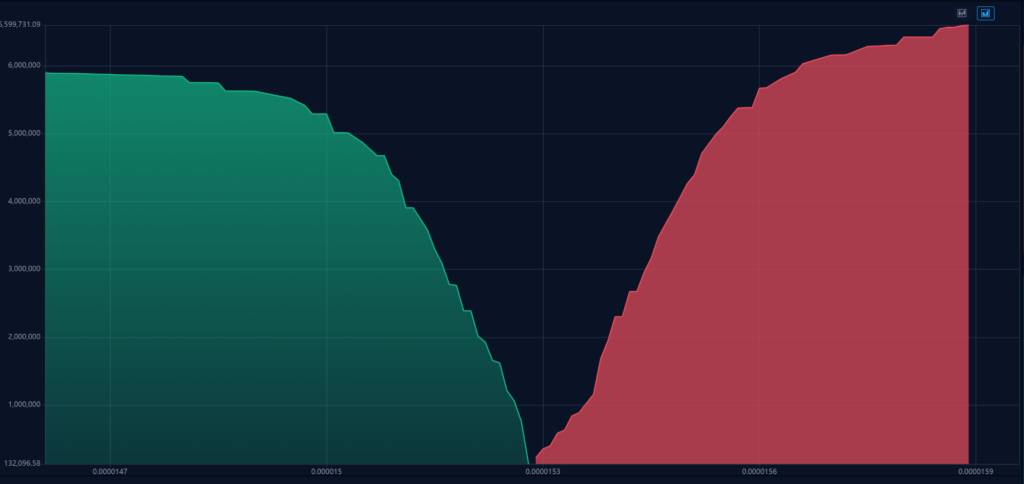
In the next example (here BTC/USDT), the volumes of the buy orders outweigh those of the sell orders. This is referred to as a buy wall. A buy wall indicates that prices will rise in the future, as there is more volume willing to buy at a lower price than there is volume willing to sell at a higher price. You can imagine a sell wall in the same way.